T-SQL Tuesday #16: Statistics using CLR Aggregates
08 March 2011
[
It is T-SQL Tuesday again, brought to you by Jes Schultz Borland (@Grrl_Geek). The theme for this T-SQL Tuesday is Aggregations.
For my T-SQL Tuesday post, I’ve written up some CLR aggregation functions that can do statistical analysis. I’ve built three of the most common: median(), percentile(), and covariance().
Here’s my code in a ZIP file: MathCLR - By Dev Nambi.
Median
Median finds the middle number in a set of data. If you sorted the numbers and then picked the exact middle value, that is the median.
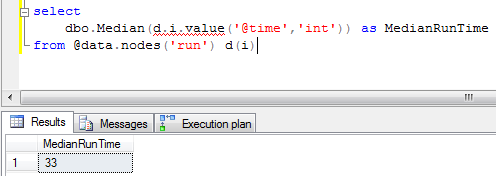
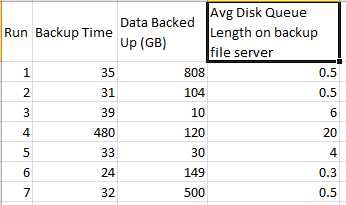
I’m using the same sample data set from my last post, which is about the runtime of a backup job over the past week. As we can see here, the median runtime is 33 minutes.
Percentile
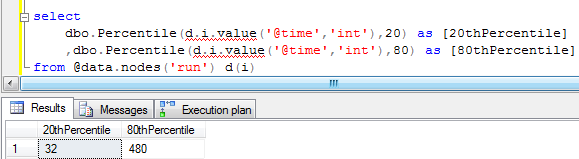
Percentile finds the number under which X percent of the values fall. Using our sample data set, we can find that 80% of the backup runtimes are under 480 minutes.
The way to use the function is to pass in the data set as the first parameter, and the percentile you’re looking for as the second.
Covariance
Covariance is less well known. It shows the relationship between two sets of numbers. It finds the _correlations _between two sets of numbers.
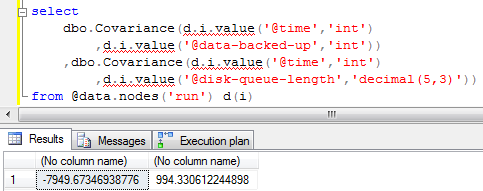
Using our data set, let’s see if there’s a relationship between backup time and the amount of data backed up. As we can see below, the covariance is negative. That means that either the backups get faster as they get larger (unlikely), or something else is at work.
How about a relationship between disk queue length on the backup file server and the runtime? Aha! That shows a very high covariance, suggesting that the disks on the backup file server are the bottleneck. Either the backup server is too slow, or else some other process is slowing it down.
Good luck with your analysis!
PermalinkStatistical Analysis 102: Median, Percentile, and Covariance
08 March 2011

I love statistics. That’s right, I said it. I love statistical analysis. It is a great way to find meaning in data. If you have a critical eye, it can be a great way to find meaning in data. This is especially important because we see large amounts of data everywhere
I’m going to go over three standard ways of analyzing data sets: medians, percentiles, and covariance.
Data, Data, everywhere!
Before we begin, we need some data to analyze. Let’s use the runtime of a backup job as an example. Let’s analyze the last seven runs, looking for meaning.
Medians
When someone asks, “What’s the average runtime?”, that can mean a few different things. Most people think of the mean, which is the sum of all values, divided by the number of values. In this example, the mean runtime is 96.28 minutes. That’s not very helpful, because most of the runs are far less than that, with only one run being larger. So the mean runtime doesn’t describe the data at all.
The median runtime, however, is 32 minutes. That is very useful because it describes the expected behavior. A median() aggregate is more useful than an avg() for finding middle values when the data is skewed.
Percentiles
Percentile finds the value under which X percent of the numbers lie. For example, the 50th percentile of numbers 1-100 is 50. The 93rd percentile is 93. This is a great statistical measure because it tells us how spread apart our numbers are.
Using our sample data set, we see that 80% of the backup runtimes are under 38.2 minutes. We can also find that only 20% of our backup runtimes are under 31.2 minutes, which means that we can expect backup times of 31.2 to 38.2 minutes around 60% of the time (80th - 20th = 60%). That’s a fairly predictable backup job.
Covariance
Covariance is less well known. It shows the relationship between two sets of numbers. It finds the _correlations _between two sets of numbers.
If the covariance is 0, there is no relationship. For example, prices on the stock market don’t have any relationship with how hot your coffee was this morning.
A negative covariance means the two values are inversely related; one rises when the other falls. A great example there is the number of hammock sales in a city compared with its average snowfall. The more snow, the fewer hammocks get sold.
A positive covariance means the two values are related; when one rises, the other rises also. For example, oil prices and the cost of food. When oil prices go up, the cost of food goes up as well.
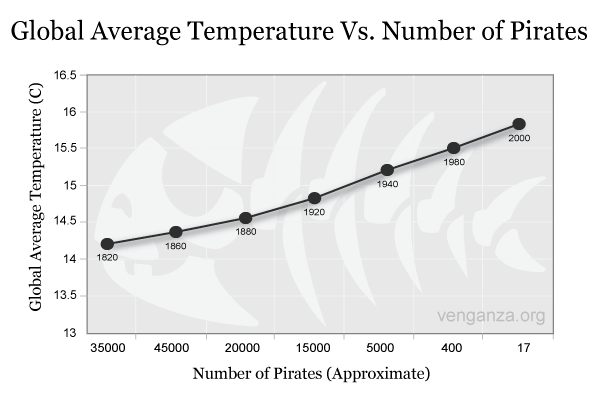
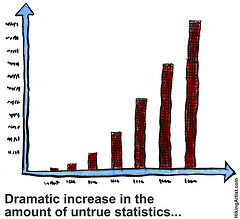
Pirates and Global Temperature have a negative covariance
Further reading
For anyone in IT or computer science who wants a good grounding in statistics, I would highly recommend Data Analysis with Open Source Tools