PASS Business Analytics 2014
15 June 2014
A few weeks ago I had the privilege of attending of the PASS Business Analytics conference (PASS BAC) with 750 other data geeks in San Jose, CA.
The last conference I had attended was Strata, another data-to-decisions shindig. I’ve decided to compare and contrast the two.
Similarities
Data Geeks, Joined
The SqlPass and Strata communities have some things in common:
- There are many specialties and specialists
- Everyone is learning and trying new things
- There’s a vocal and helpful community on Twitter.
- Many brilliant engineers, researchers and developers strive to be helpful.
- There are lots of vendors arguing that they have a deus ex machina.
Lucky
Everyone wants to get more out of their data. Businesses are desperate to do so. We data scientists, analysts and engineers are paid to work with data.
We’re in the enviable position of being well paid to do the work we love. Most such jobs pay poorly: teaching, global health, cancer research, nursing, cooking, music, art, English, history, biology, physics, etc.
Data Cleansing
One of the best events was Wednesday’s unconference session. It was a rare chance to crowdsource discussion topics and expertise.
One of the problems everyone has is cleaning up data. Surveys show that over 80% of a data project is spent cleaning up data.
This is, sadly, an area with comparatively few tools. People built their own solutions, using 3 different approaches.
Clean with Code
This is the first approach everybody thinks of when facing a data-cleaning problem. They find patterns in good data, and use rules (if/then, case, switch statements) to clean up data. This is often the ‘T’ (transform) in an ETL process.
This approach has flaws. It requires lots of development time to prototype, implement, and validate. It’s hard to debug, especially if there’s a data pipeline with multiple, sequential data-cleaning steps. It also does not handle new errors or edge cases well, so it requires ongoing developer support to maintain.
Clean with Vendors
This is the second approach. Some data-cleaning problems are so common that many businesses face them. Cleaning up addresses is a canonical example.
When you’re facing a common problem, use a common solution. Buy a third-party product or service and have it do the tricky work. After all, there’s no reason thousands of companies need to build their own address-cleaning pipelines.
However, this approach doesn’t make sense when the data to clean is internal (custom) or sensitive (SSNs, banking data, medical records).
Clean with Math
The third approach is my favorite: math. Specifically, statistics.
There’s an entire branch of statistics devoted to detecting when data is missing or if an outlier can be safely discarded. Most importantly, there are techniques here that let an analyst know whether missing/outlier data meaningfully changes the result of a problem. This is what scientific research has done for decades.
The other half of this approach is machine learning. Let’s see using our address problem. Imagine that we strip an address down to its component parts (building number, street, apartment/suite, city, post code, etc.). We can then train a machine learning model to look at an address’ text, assign probabilities that each bit of an address belongs to one of those elements, and predict how likely that piece of data is what we want.
There are very few tools for this approach thus far. That means you have to build these solutions in-house, and for that you need a machine-learning savvy developer. They’re awfully rare.
Differences
Techniques
After getting a disappointing Data Science Bingo score during the Thursday morning keynote, I set out to find out how common certain tools and techniques were in my audience. I asked 33 people which technologies they knew about or used.
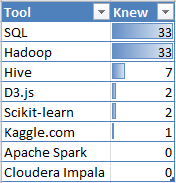
In addition to asking about specific tools, I also asked about tool-neutral techniques for analyzing and processing data.
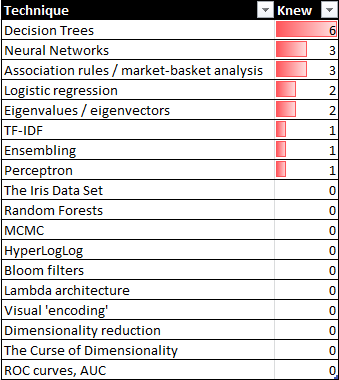
The attendees may be future data scientists, but this sample suggests a distinct gap in their machine learning, statistical, and engineering skills. I found only a few promising analysts in my survey.
Technology Stacks
The main limitation of PASS BAC is that it’s a Microsoft-centric conference on data analysis. That’s like having a World Cup with only the U.S., Canada, and Belize.
The most common command-line tools for data analysis are Python and R; they have amazing libraries and support reproducible research. Microsoft has Excel, which has terrible library support, and no support for reproducible research. It’s contributed to world-economy-changing, fascist-government-inspiring screwups.
One way to think of code is that it’s a precise form of communication to other people as well as to machines. The only practical way to do command-line data analysis on the MS stack is to run a Linux VM in Azure. Oops.
Audience Goals
Strata and PASS BAC have one huge difference: their implicit messages are different.
- The message from PASS BAC is: empower analysts to make data-driven decisions for their business.
- The message from Strata is: deprecate analysts. Give customers the tools, and they’ll make your business successful.
This shows up a lot in different lessons. PASS BAC sessions are predominantly about how to help analysts solve X or Y problem.
Strata sessions are about solving X problem, and evolving the solution to an automated process or data product (Google Search results, Netflix movie recommendations, Hotmail’s spam filter, and LinkedIn’s “People You May Know” suggestions).
PASS BAC assumes there are data-hungry, precocious analysts in every company that will magically find insights if you feed them a diet of raw data and Excel. That’s a dangerous assumption.
The maturity curve of BI is long, but it bends towards automation.
This is an organizational challenge: how do we empower people to solve challenges that are beyond their current capabilities? There are 4 options.
Option A: dumb down the problem so people can solve it using their existing skills
Option B: educate people so they can tackle the problem.
Option C: use a different approach so there are no people in the first place
Option D: tackle a different problem
Tool-building vendors take the first approach. Their value proposition is “we solve your biggest challenge using our deus-ex-machine tool.” That sounds a lot better than “your staff’s outdated skills are your biggest challenge, we just help out with a smaller problem.”.
Communication
Another common challenge I heard discussed was communication lapses. A battle of resources, priorities, and perspectives between developers and IT admins is still ongoing for the PASS BAC attendees.
There were some common lessons that people liked:
- Fix the incentives. People behave according to their incentives.
- Remember that the first feature of any product is that it works.
- Don’t expect you can overhaul company culture. If an engineering org is enlightened enough to build clean code the first time, stay. Otherwise: run.
Industries
Strata was heavily represented by startups, academia, and scientific researchers; PASS BAC had established industries, such as insurance, finance, and retail.
These audiences are different, with different goals. Strata felt fast, even frantic at times. Startups are always rushed. Scientific research never has enough resourcing.
PASS BAC was slower, more methodical. The goal of the audience isn’t to disrupt an industry, but to defend one. They have far more resources, and assume they have lots of time.
Laggards
When companies are slow to adopt data-driven decision-making, I wonder how they do some things:
- Make difficult, contrary decisions because the data says so
- Present data contrary to what upper management wants to hear, with a suggestion to do something different
- Have senior managers / executives make course changes based on new data.
- Run controlled experiments or do econometrics analysis to find causal relationships between business variables/ideas.
A huge part of an organization improving using data is the cultural approach decision-makers make with it. A key question is what decision makers do when the results of data analysis disagree with their ‘gut’.
David McCandless
The best session, by far, was David McCandless’ (@DavidMc, Information Is Beautiful) .
I was awestruck by how he used visualizations to illustrate the gaps in human perception. For example, using relative amounts to illustrate what one billion looks like, a million lines of code, or the probabilistic results in the Drake Equation.
It makes sense to use visuals to communicate, since we use 75% of our sensory neurons to process what we see. Data visualization is a type of communication. Its goals are the same as any kind of communication: clarity, emotional connection, and minimizing misunderstandings. If you want to learn the principles of data visualization, study communication and journalism.
There are a few common things to do and avoid.
Ways to Succeed
- Work on a useful question or problem. Work on something interesting.
- Be trustworthy. Act with integrity.
- Remember form. Your results must look good, and have a certain standard of quality.
- Remember function. Your results must be easy to use.
Ways to Fail
- When you visualize a complex data set, you make a graphic that’s complex. That doesn’t solve anything.
- Circular diagrams aren’t very usable. Humans don’t perceive arcs and wedges clearly.
- Cartograms…hard to get the data out. Very hard to compare.
- Design is really about removing things, cleaning down to a functional essence.
Next
Despite having a fun time speaking and chatting at PASS BAC, I doubt I’ll go back. It’s a useful conference for BI practitioners in established industries, looking for incremental improvements. There’s nothing wrong with that, but it’s not for me.
I can network better at a local meetup, learn more by doing my own research or reading a good research paper. I can reach a wider audience with a blog post.
PermalinkExercise Using Data
18 April 2014
There are many choices when looking at nutrition, exercise and medicine. Most people in the US and Europe suffer, pay, and die from chronic ‘lifestyle diseases.’
One of the best ways to be healthy is to be moderately active. That’s not news, and it raises a confusing question:
Why do many people suffer from preventable diseases when there are many ways to avoid them?
I suspect having so many choices is a challenge on its own. It’s easy to pick between 3-5 options; it’s impossibly hard to pick from thousands. Being healthy is a data problem.
Data can make it easy to decide what to do right now to be active.
Stalling
People will often start a new sport and then stop. Why?
Researchers asked this question, and found several reasons:
- It’s expensive
- It takes a lot of time
- The weather is bad
- It doesn’t feel like fun
- It feels embarrassing.
3 of these reasons are external (time, price, weather), and the other two are mental (fun, embarrassment).
Finding exercises that work for each person isn’t a marathon, it’s a maze.

Price
People avoid expensive exercise. After all, the median US income is ~$51,000 per household; it’s only logical to worry about money.
However, “expensive exercise” is a matter of perspective. Exercise is far cheaper than $6,000/year for heart disease, or $11,700 for diabetes.

Time
Exercise takes time, and there are no shortcuts. You can’t fit 30 minutes of exercise into 5 minutes.
There are ways to integrate exercise into a busy schedule. People often exercise immediately before or after their work day. Some sports require no prep or travel time. Others can be done during small breaks.

“Time wasted on exercise” is again a matter of perspective. The time isn’t wasted, it’s traded. What do we trade this time for?
Quite a bit, it turns out. Active people live longer, sleep better, have a better quality of life, better brain function, and suffer less from depression.
That’s a great for less than 4 hours/week. Even better, many quick exercises are also inexpensive.

Weather
The best sports are the ones suited for each time and place. Nobody likes to run when it’s snowing outside. There are also many, many ways to be active indoors.

Know Thyself
Humans avoid behavior that isn’t rewarding or seems disappointing. Our largest hurdles are often between our ears. A common mental barrier is social. We each react differently to social situations:

- Do you push yourself more when your results are visible to your family & friends? Or does that make you feel isolated?
- Do you enjoy trying new activities? Or do you enjoy having a few familiar exercises?
- Does a competitive sport make you try harder, or give up faster?
It’s important to know this, because it’s important to develop exercise as a habit. After all, we each have a finite amount of willpower each day.
The Power of Language
We think and feel in narratives, in stories. I use this to manipulate myself into exercising.
I don’t use sports terms when exercising because I was the slow kid in gym class, and don’t enjoy remembering embarrassing moments. I think of exercise as leveling up.
I love to cycle because I see it as ground-effect flight. I enjoy snorkeling by imagining it is neutral-buoyancy meditation. I enjoy laser tag as a way to be active and invent creative tactics.
After all, what kind of exercise we do is far less important than just being active.