SQL Saturday 265 - Tips for Presenting
05 November 2013
This previous Saturday was SQL Saturday Oregon. My favorite was a workshop Q&A about how to give technical presentations, organized by Jes Borland. Present were a good mix of newcomers, experienced speakers, and inexperienced speakers. Here’s what I took away from the session.
Why Should I Speak?
- Technical presentations make you more comfortable when speaking at work.
- Technical presentations make you more comfortable speaking in public, which is a great skill.
- You meet new and interesting people. The networking is great.
- It’s a great way to conquer a fear.
Getting Started
- Use the ‘Rule of 3’ - present 3 key ideas, and that’s it.
- Rehearse. A lot.
- Record yourself. See how you look afterwards. Adjust. Repeat
- Relax before you get on stage. Take a deep breath.
- Start off someplace friendly. Work “lunch brownbags” are good. SQL Saturdays and user groups are great.
- Tell people to ask questions at the end. Then they won’t interrupt when you’re speaking.
- If you feel confident that you can get back on topic, allow questions during the presentation.
- Do not go on tangents.
- If you are running short of time and need to skip ahead, don’t advance through many different slides if you need to catch up. People feel like they’re missing out.
- Bring up a demo, flip to the right slide, and then flip back
- Or, go directly to the appropriate slide if you’re running in ‘Presenter View’
- Add a smiley face to your laptop background or post-it. It’ll make you smile more. That helps the audience bond with you.
- Do not, DO NOT B.S. your way out of question you can’t answer. Say “I don’t know, let’s work on it together afterwards” and keep going.
- Most of the session demand is at the 200 level (advanced beginner or intermediate). Most people wear many hats, and they’re trying to learn and progress. They haven’t specialized enough to need a 400- or 500-level talk because they can’t.
- Add a little humor, especially self-deprecating humor.
Titles and Abstracts
- First, start with ideas.
- Then build an abstract from those ideas
- Build an outline
- Send the abstract (and outline) to speakers who are approachable. Ask for their help. They probably will.
- Titles are difficult, and important. Often people will only look at the titles
- Putting funny jokes, or pop-culture references in titles doesn’t translatein large, culturally diverse events.
- Having a slightly cute presentation title depends on the conference culture. SQL Saturdays and PASS Summit love slightly cute titles. Tech-Ed really doesn’t.
Audience Selection
- Explain what the session is about. Then tell people it’s OK to leave if it isn’t what they expect. This is a good thing.
- It’s not personal.
- You end up with a more engaged audience, and fewer difficult audience members.
- This improves your session evaluations, which ask “did you learn what you were expecting to learn” and “did the session meet your expectations”
Being present
- Look at your audience, not the screen
- Use a presenter mouse or presenter ‘wand’ and walk around. You can advance the slides remotely. This works great for slides, not demos.
- Ask for a show of hands. It keeps people engaged.
How to Keep From Speaking Too Quickly
- Practice.
- Add time marks on the slides. Slow down if you see yourself going too fast.
Difficult Audience Members
- They’re relatively rare.
- Most common type is someone who wants to be the “smartest person in the room”, and stump the presenter
- Say, “That’s interesting, but a bit off topic. If you and anyone else wants to chat, come up afterwards. We can work on it together.”
Demos
- Practice them
- NEVER, EVER type in a demo
- Optionally, record a demo, and play it back live.
How to Recover When You Bomb Onstage
- Laugh
- Apologize. “Oops. Lost my train of thought. Sorry about that”
- Take a deep breath
- Move on
- Practice screwing up in rehearsal. Practice recovering.
- Have a plan B if things go sideways, especially for a demo
The Seattle Art Museum with Data
05 November 2013
How can data help the Seattle Art Museum?
This was a thought exercise from my last University of Washington Data Science class.
In the Beginning was the Context
The goal of the Seattle Art Museum (SAM) is “a welcome place for people to connect with art and to consider its relationship to their lives.” Art is undergoing critical challenges. The emphasis of STEM in schools and civil discourse has de-emphasized (and often de-funded) arts and the humanities for the next generation.
The amount of content people consume is increasing, but it’s all online. Art museums can’t compete against Reddit for mass appeal.
People aren’t doing very well, either. The average family has less income and job stability than 30 years ago, even as the US GDP is up 350% and the stock market is up 500+ %. Chances are you have more immediate things on your mind than art.
Art and Relevance
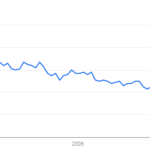
Google searches for “art museum” have been trending steadily downward over the past several years.
In 2011 SAM had 600K visitors, which is ~16% of the Seattle metro population. It’s worse than that, because many visitors are tourists or repeat customers. A more useful number is membership counts, 48K, which is ~1.3% of the Seattle population.
Oh, and that was the most popular year _SAM ever had, _because of a Picasso exhibit.
I asked 30 random people in downtown Seattle what they thought about the art museum, which was less than 3 blocks away.
- 14 of them didn’t know there was an art museum there
- 13 of them had never been there, and didn’t seem interested
- 3 had been to the art museum, but wouldn’t go again soon because “it’s too expensive” and “it wasn’t interesting”
- 0 of them knew it was there and would go again.
The plural of anecdote is not data. However, this experience reinforced what I found via Google Trends: most people don’t think of art at all, let alone in their daily routine. Therefore the biggest challenge is to find ways to make art more relevant to people’s lives.
Goals and Ladders
The best way to tackle a huge goal is to break it down into its key pieces.
- Figure out how art can be relevant for different groups of people
- Tailor SAM to different groups of people
- Find ways to bring those different groups of people to SAM itself
That’s it. You’ll notice a non-goal is to make SAM more profitable. It’s a secondary goal, because there’s no point in having a rich museum that nobody visits.
From Goals To Questions
Once we have goals, let’s start asking questions. Let’s think of art museums as fundamentally a data problem, with the potential for data-driven results.
Groups of People
People are different, and react to experiences differently. What are the characteristics of SAM visitors? What kind of art does each person enjoy? Why do they come to the museum?
How can we identify why certain groups of people enjoy certain kinds of art? What can we do to make that art even more interesting to them?
Groups of Art
What pieces of art are similar? How can we identify that? How can we identify new art and who will enjoy it?
What is the best way to use this information to tailor current and future art exhibits? What new, interesting art style will be a hit, even if nobody knows it yet?
Art Online
People are spending an increasing amount of time online. That’s helpful; art is a very visual medium. How can we use that? What visual services can be used to spread the word about art? Facebook? Pinterest?
After all, 61% of people in the US have smartphones, and 85%+ of people in the US have an Internet connection.
How can art be used to illuminate the current events and daily routines of our lives?
Science and Experiments
A key concept in data science is the scientific method. Each of the questions above can be measured and tested using controlled experiments.
Figure out how art is relevant for different groups of people
People spend more time near art they enjoy. Give every visitor a tablet or guidebook with an RFID tag, and use that to track where each visitor goes inside the museum. Identify the demographics and characteristics of people who visit each exhibit.
But, most people don’t visit the museum. We need a larger sample, from a broader audience. Let’s have a monthly museum ‘free day’ to cast a wider net, and collect more data.
Once we have enough data, let’s build a predictive model to anticipate who will visit what art. Then let’s re-arrange the museum and see if our predictions hold true. If they do, then we’re onto something.
This is a type of collaborative filtering called user-user similarity.
Tailor SAM to different groups of people
The previous section’s data gives us more than just user behavior, it also tells us about art similarity. If 97% of the people who visit exhibit X also visit exhibit Y, then those exhibits are probably similar.
We can use this to build similarity groupings for art. Let’s identify characteristics about each group of art. Then we can use that to identify new kinds art that we think will bring people to the museum.
This is a type of collaborative filtering called item-item similarity.
Find ways to bring those different groups of people to SAM itself
The insight from the previous 2 sections provides the grist for a highly successful marketing campaign.
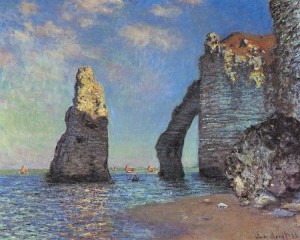
For example, if men ages 18-25 like impressionist art, then showing Monet paintings on video games would make a lot of sense.
Finally, we would customize the Seattle Art Museum website to display different content depending on the user.
What Now?
“The future is already here - it’s just not evenly distributed” - William Gibson
I suspect what I’ve described above would be far more advanced than most museums could do. However, it’s something that most retail stores do every day. Larger companies like Amazon, Netflix, eBay and Etsy do this far more, because it’s a key advantage to their business.
After talking with nonprofits, I realized the biggest challenge isn’t coming up with an idea, but finding skilled engineers. That’s where you, dear reader, come in. The majority of my readers are data professionals. You have the ability to help a nonprofit or small business grow this way.
Permalink