Cheap Computing with AWS Spot Instances
16 November 2014
You can run Amazon Web Services’ VMs cheaply by bidding for computing capacity, using Spot Instances. The virtual machines (instances) you get are identical to on-demand VMs. The only difference is the pricing.
To do this, you request spot instances, and specify the maximum bid per hour you’ll pay. If your maximum bid is more than the current bid for that type of VM, your request is granted. As long as the current bid price is less than your maximum price, you’ll keep your computing capacity. If your maximum bid is ever less than the current bid price, then your instance is destroyed and its capacity given to a higher bidder.
My first reaction to spot instances was disbelief. Why should I use a virtual machine that can be destroyed at a moment’s notice? I’d never get any work done! Then I saw the price tag…
Spot instances are far cheaper than their on-demand brethren.
If you specify a high maximum bid (say, 3x the on-demand price, here’s the daily cost over 90 days to run 7 different instance types in the Oregon (us-west-2) region:
| Instance Type | On-Demand | Spot | Discount |
|---|---|---|---|
| t1.micro | $0.48 | $0.13 | 73% |
| m3.medium | $1.67 | $3.91 | -134% |
| c3.xlarge | $12.39 | $2.30 | 54% |
| r3.4xlarge | $10.00 | $6.82 | 80% |
| h1.4xlarge | $73.96 | $5.91 | 92% |
| g2.2xlarge | $15.50 | $2.71 | 82% |
| cc2.8xlarge | $47.77 | $7.14 | 85% |
Not everything is a deal. A few VMs (like m3.mediums) were more expensive than on-demand VMs. However, most types and locations, including most of the powerful choices, were much less expensive.
When computing capacity is this cheap, economics starts to change. It may be cheaper to use spend developer time to re-architect an application to run on spot instances. A company that runs dozens or hundreds of AWS instances may well save money by using spot instances:
Startups have it easy. They can build their system architectures to use this environment from the start. Of the 30-odd startups where I have contacts, all of them use spot instances widely, to save money.
There are several approaches to doing so, including:
- Run everything statelessly, using queues and permanent storage.
- Run spot instances as part of resilient architectures that can compensate for failures
It’s All About the Money
To learn more about spot instance pricing, let’s look at history. This is easy; AWS exposes both a price history API as well as documentation. It’s easy to use the API to download data. I pulled down 90 days’ history for every Amazon region, availability zone (AZ), and instance type.
All of the prices below are the median daily cost to run a VM with an infinite bid, unless noted otherwise.
Prices by Region
To start, prices vary dramatically by location. The discounts you see below are the % difference in price between a spot instance and an on-demand instance in the same location.
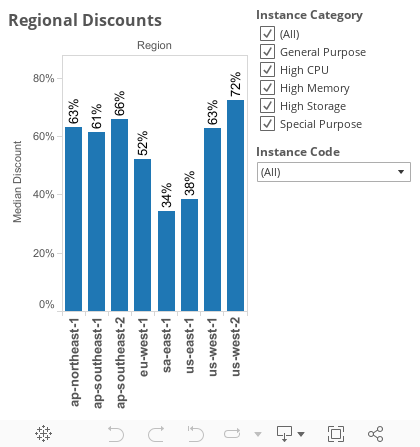
As we can see from the graph above, the median discount between on-demand and spot instances to run a VM for a day ranges from 38% (Sao Paolo) to 72% (Oregon).
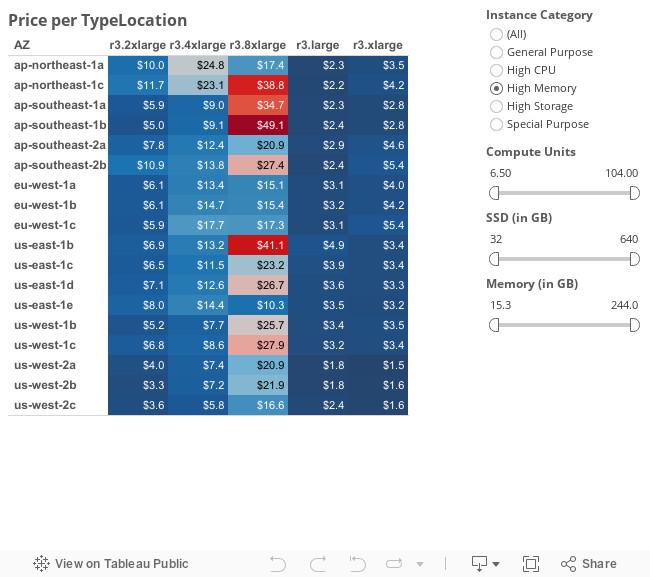
Prices by AZ and Instance Category
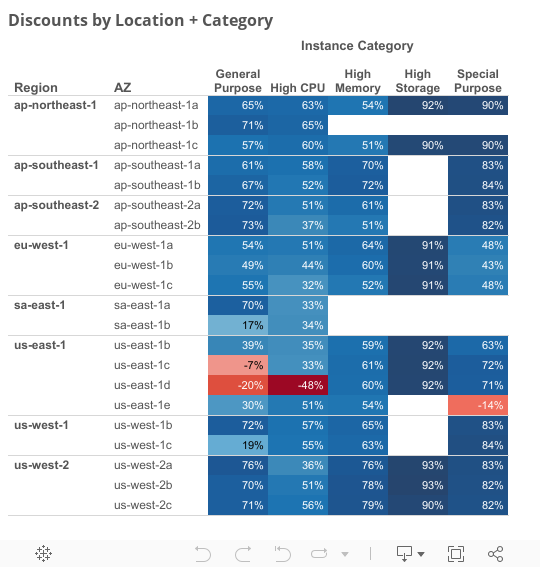
Looking deeper, some Availability Zones (AZs) have far larger discounts than others. A few instance categories are really cheap.
Not all AZs have the same discounts, even in the same region. This doesn’t make sense; it’s evidence of inefficient bidding by AWS users. However, it’s fantastic news for bargain hunters.
For example, if I had a workload in Northern Virginia (us-east-1) that needed a general-purpose instance, I’d pick the AZ with a 39% discount (us-east-1b) instead of the one with the -20% discount (us-east-1d).
The differences are larger across regions. In Oregon (us-west-2) we could run 30 m3.2xlarge VMs for less than $100 a day, instead of ~$400 a day for on-demand instances.
That’s $100 a day for 900GB of RAM, 780 compute units, and 4.8TB of SSD storage.

Prices by Instance Type
Some instance types have reliably larger discounts.
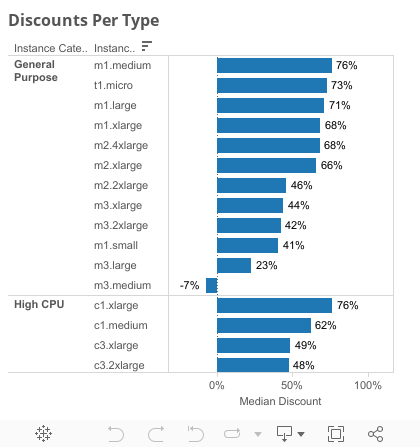
High-memory types (the r3 family), the h1.4xlarge storage type, and cluster computing types often have deep discounts.
Hunting for Deals
Now let’s look for the biggest deals we can find. Let’s look at every single instance type, per region, per AZ.
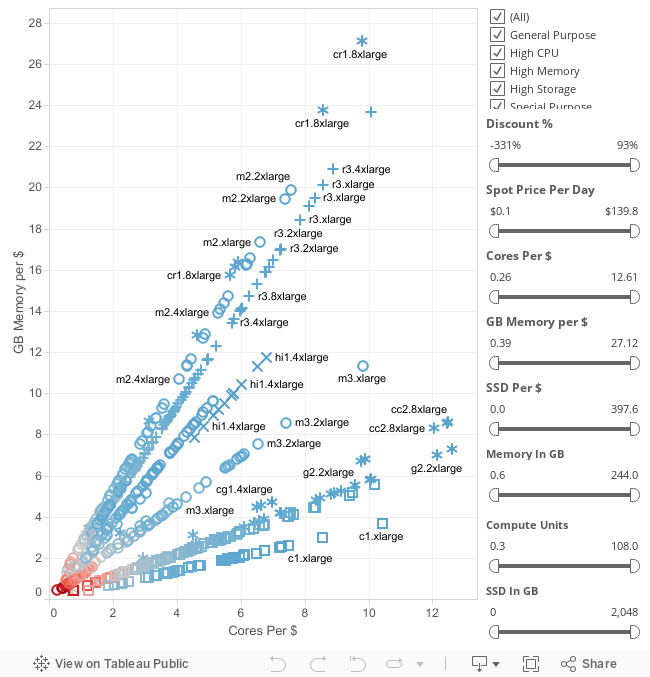
The best deals are in the upper right, which have the most cores per $ and the most GB of RAM per $.
For the last 90 days, the best deal was in the Tokyo region (ap-northeast-1). You could run a cr1.8xlarge instance (244GB of RAM, 88 compute units, 240GB of SSD) for $9 a day, instead of the usual $98 a day.
Let’s say we have a large, distributed-computing workload. Common examples are physics simulations, genome sequencing, or web log analysis. We could spend $252 for 4 cr1.8xlarge instances:
- 976GB of RAM
- 352 compute units
- 960GB of SSD
- 10Gb networking
- 168 hours to get your work done
When I do distributed data processing work, I dream about having resources like this.

Cloud Myths
Let’s use this historical pricing to look at some myths about spot instances:
Don’t use overseas datacenters, because they’re too expensive
We already looked at price discounts by region and AZ. There are some regions that don’t have huge discounts (Sao Paolo), but many others that do (Tokyo, Singapore, Australia, Ireland).
I’m guessing this comes from the fact that some overseas instances don’t all of the instance types yet, which includes some instance categories that have deep discounts, like the high-storage category.
GPU instances are expensive Bitcoin miners are eating up all of the capacity
Again, no. The g2.2xlarge GPU-specific instance has a median discount of 83% across all regions. If we look at this instance type across all regions and AZs, we can see that the typical cost to run one is in the $2.1-$4 a day range, which is far cheaper than its $15.40 a day on-demand price.
Big instances don’t help your application
This is often true. Very, very few developers or sysadmins know how well their applications scale, because they don’t have the time or resources to test them under varying load, and on different computers of different sizes. That’s a topic for another day.
If your workload doesn’t benefit from having lots of memory or cores in a single machine, then you’re better off running smaller VMs with good single-threaded CPU speed (the c3 family).
The cheapest spot price for c3 spot instances over 90 days was $0.70 a day for c3.large VMs in the Tokyo region. Those VMs have 2 Ivy Bridge cores, 3.75GB of RAM, and 32GB of SSD.
If your workload can be broken down into small, independent chunks of work (still single-threaded), you could spend $20 a day for 28 of those VMs.
The core question is never “how do I get the biggest computer for cheap”, it’s “how do I do my work for the least amount of money”.
Don’t run big instances because they’re more expensive than smaller ones
Let’s say you do know how well your applications scale. If your workload parallelizes well and works faster with lots of RAM, SSD, and compute cores, then larger instances are a great deal. Optimize for RAM-per-dollar, or cores-per-dollar, or SSD-per-dollar. In that case, your cheapest options are:
CPU Bottleneck:
For this, you want an instance with as many compute units as possible. If we look at compute units per $, the cheapest options have been the cc2.8xlarge and g2.2xlarge instances, usually in the Oregon or Tokyo regions. You can run a cc2.8xlarge instance and its 88 compute units for as little as $7 a day.
Memory Bottleneck
For this, you want an instance with as much memory as possible. If we look at GB of RAM per $, the cheapest options have been the cr1.8xlarge and r3.8xlarge instances, usually in the Tokyo (ap-northeast-1) region. You can run instances with 244GB of RAM for as little as $9 a day.
I/O Bottleneck
For this, you want an instance with SSD storage. If we look at SSD per $, the cheapest options have been the storage-centric h1.4xlarge instances. A single instance has 2,048GB of SSD storage and can be run for as little is $5.20 a day. That’s ~400GB GB of SSD for a dollar a day.
Be Contrary
Spot pricing is complicated, because it’s the combination of several different topics:
- Supply and demand (economics)
- Bidding systems, a.k.a auction theory
This is the area where quantitative finance folks thrive. Lucky for us, there’s a simple way to find deals when bidding:
Buy What’s Not Popular
PermalinkLet Me In! The Attendance Challenge
30 September 2014
Many large technical conferences have a thorny problem: It’s hard for attendees to get into all the sessions they want to attend. The solution is to do a better job with session scheduling and room allocation, assigning the more popular sessions to bigger rooms.
This year, I volunteered to help the PASS Program Team predict ahead of time which PASS Summit 2014 sessions would be most popular so the team could schedule those sessions in larger rooms.
Questions to Ask
We started with some key questions. Can we predict how many people will attend each session? More precisely, can we predict the percentage of attendees that will attend each session?
To answer those foundational questions, we needed to find which factors were correlated with session attendance. Is it the time of day? Session topic? Speaker level? The track? The popularity of the speaker? Their session feedback scores?
It was clear what we needed: data!
The Program Team started collecting data about sessions from Summits 2011 through 2013, including:
- Session details (title, track, level, speakers)
- Session attendance and room size
- Session start/end times
- Session feedback scores
- Speaker popularity (Twitter followers, Bing results count)
- (derived) The percent of each event’s attendees in each session
This took quite a bit of time and the use of various tools: Python, Excel, and SQL. Finally, we had a CSV file with all of the different inputs.
Note: for privacy reasons, the session feedback scores have been removed from this file, even though they were used in the analysis.
For this initial project, we began with a fairly limited data collection; we didn’t try to do topic modeling for session content, include the amount of demos, or do more advanced feature extraction (such as calculating betweenness centrality using Twitter followers).
Analysis and Discovery
Now it was time for the fun part: analyzing the data. One of the best ways to understand data is to visualize it. Let’s see the breakdown of the most popular sessions, defined as the percentage of PASS Summit that’s in each session.
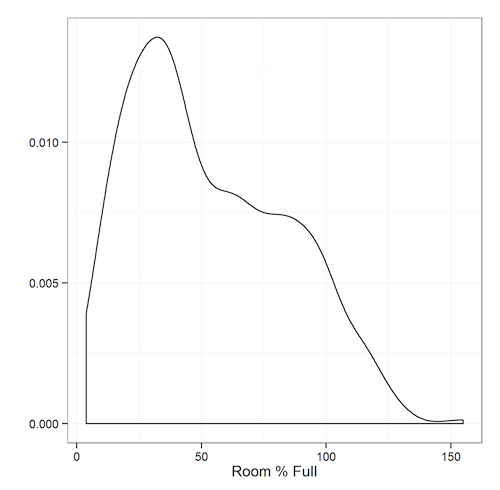
We can see that the data isn’t normally distributed; there are some overcrowded sessions, and a bunch of sessions with decent attendance. Very few sessions are practically empty.
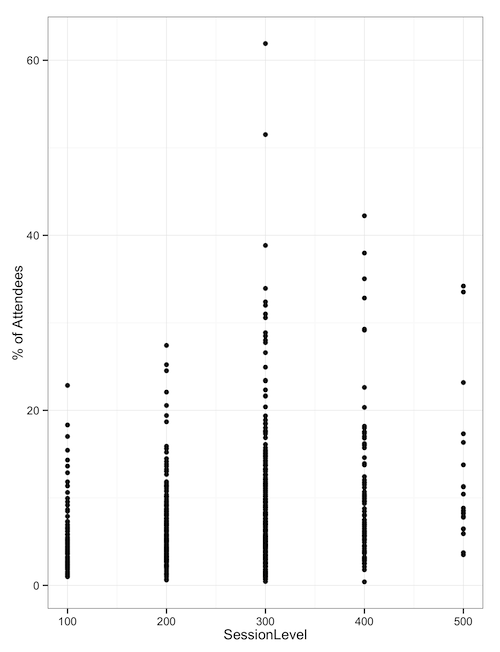
When we look at the percentage of attendees based on the session level of sessions attended, we can see that the 300-level and 400-level sessions have the most popular outlying sessions - the ones we need ballrooms for.
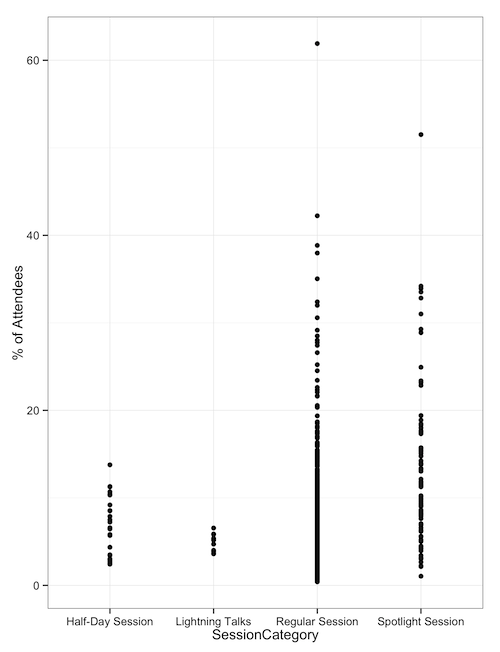
When we look at sessions by category type, such as half-days, Lightning Talks, regular sessions, and ‘Spotlight’ sessions, we see that regular and spotlight sessions are the ones with outliers. Half-day sessions and lightning talks don’t draw huge crowds.
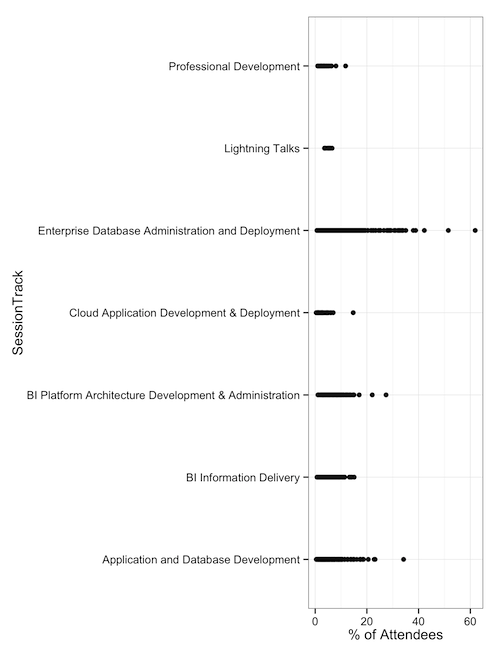
Finally, when we look at session tracks, we can see that DBA-focused sessions have drawn our largest attendance. This might be enough for some folks to make a decision: Put 300-level DBA sessions in the ballrooms. But from this analysis, we still don’t know whether the track or level is enough of a factor to matter.
Bring in the Machines
Our data set has a mix of categorical data (track, talk type, length) and numeric data (speaker Twitter follower count, session feedback scores, search engine popularity, etc. ). Also, our data isn’t normally distributed. What we needed was a machine learning algorithm that could do regression, which is predicting a numeric value (rather than just a true/false value).
There are several machine learning algorithms that work in this space, but one of my favorites for this scenario is random forests. It’s a variant of decision-tree algorithms that uses bagging and cross-validation to avoid overfitting.
One way to test the accuracy of a prediction is to predict things where we already know the answers. We can see that of the 800-odd sessions being analyzed, we can predict their attendance with a roughly 20% error rate. That means a session with a predicted attendance of 200 would have between 160 to 240 people.
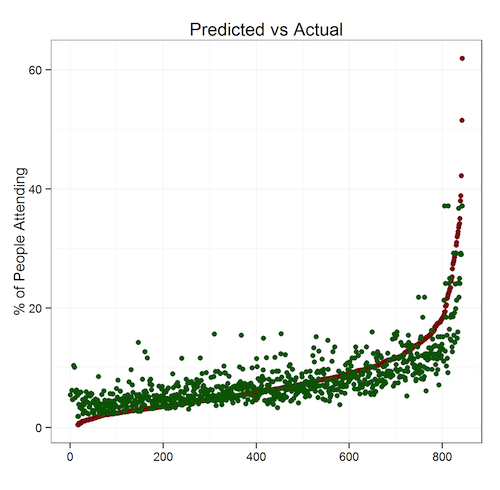
Because we’re trying to predict which sessions are unusually popular, a 20% margin of error is acceptable. Running these algorithms on the 2014 sessions data produced this output. One of the key findings: popular speakers draw big audiences regardless of topic.
We could, in theory, use a series of linear equations (or a programmatic solver) to solve this for us and build a schedule automatically. However, this is our first pass, so we didn’t want to go that far. We had predicted attendance numbers for each session; that was enough.
How Did PASS Use This Data?
With the forecasted attendance numbers, the Program Team got to work. They first assigned the sessions with the highest predicted attendance to the biggest rooms (the ballrooms) and then worked down the list. Once the first pass of the schedule grid was filled, the team made adjustments, taking into account other considerations, including topic dispersion and speaker schedule/travel restrictions.
Of course, no optimization problem like this is ever finished. So, the Program Team’s going to be collecting actual session attendance numbers, look at other inputs, and will improve the model for the future.
During “Office Hours” at Summit 2014, I’ll be joining the Program Team to talk about this effort with anyone interested. Please bring questions, ideas, feedback, and coffee. Lots of coffee.
You can also contact me anytime via Twitter (@DevNambi) or email ([email protected]).
See you at PASS Summit!
Permalink