PASS Summit - Topics, Topics Everywhere
05 March 2015
Background
Technical conferences live and die by their community, and their content. A community conference like PASS Summit succeeds when it helps its presenters.
Several weeks ago, PASS advertised a survey, asking the community what topics and sessions they would be interested in. The survey link was sent out with the PASS Connector to 122.5K subscribers, and there were 85 responses. That’s roughly typical for large email surveys.
Survey results and analysis
The raw survey results are available. However, one limitation with survey responses is sampling bias: survey results don’t reflect the audience they represent because some types of people respond more than others.
For example, 10.4 % of PASS Summit 2014 attendees were consultants, and yet only 3.6% of the survey responses were. To compensate for this, I biased (weighted) the survey results to be representative of the distribution of Summit attendees. In this example, consultant responses would be weighted by 2.88 (10.4% / 3.6% = 2.88).
The weighted survey responses are on GitHub.
Overview
Session Content
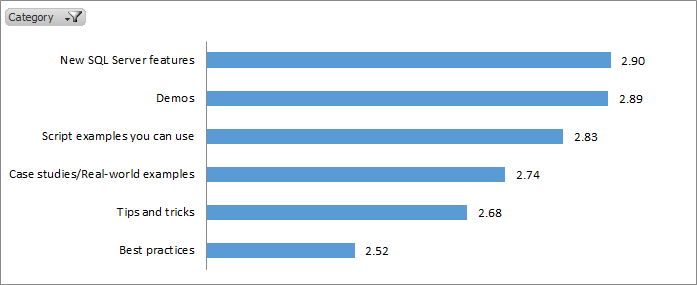
On a scale of 1-4 (4 meaning ideal interest), the most popular session content is for new SQL Server features, demos, and script examples.
Session Format
Tracks
Topics of Interest
Azure
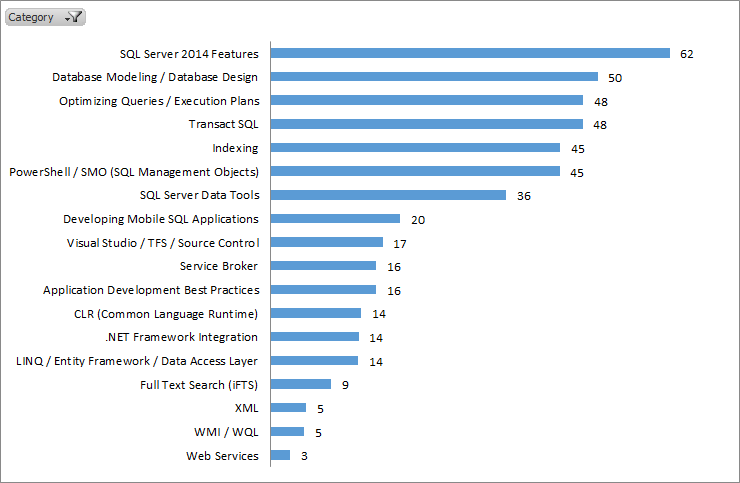
Application Development
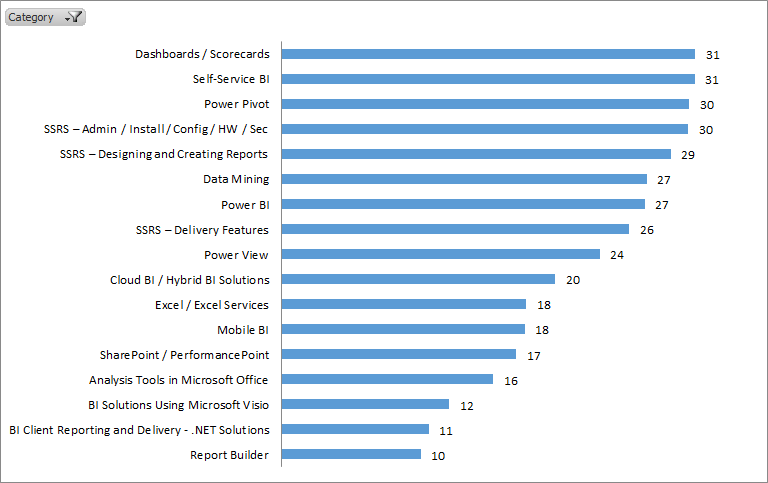
BI Information Delivery
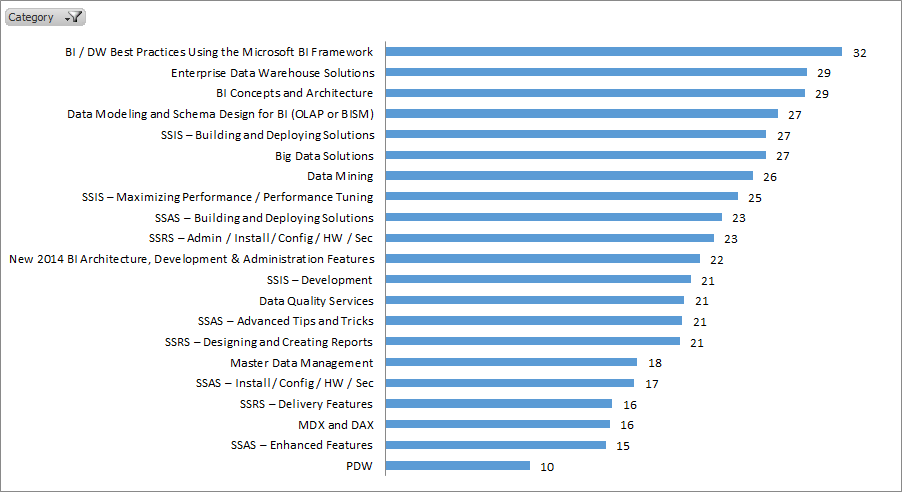
BI Platform Architecture
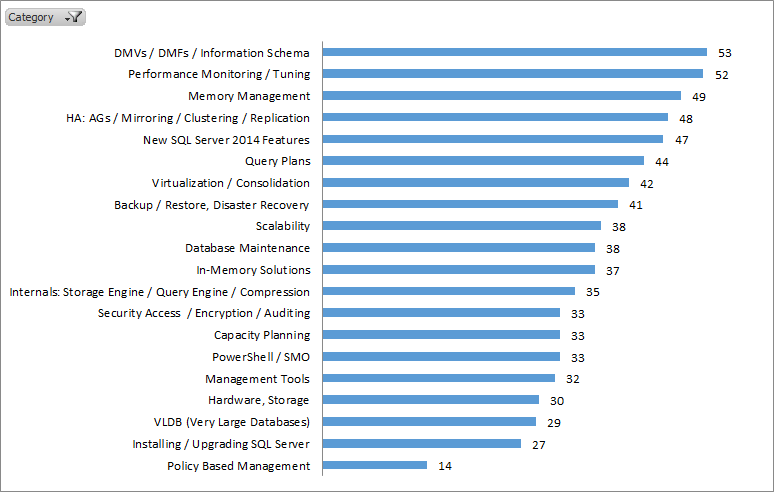
DBA
Professional Development
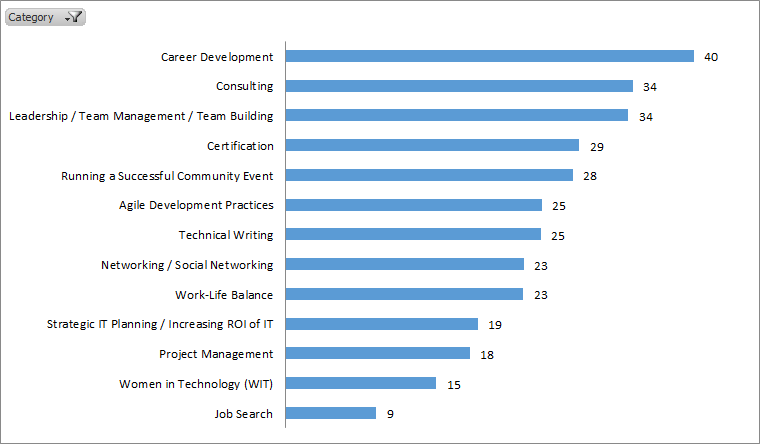
Interpretation
Looking at the data, I find a few interesting narratives:
- PASS Summit is a mature conference, and many people are return attendees. As a result, many of the best practices, tips-and-tricks styles of sessions have been done before.
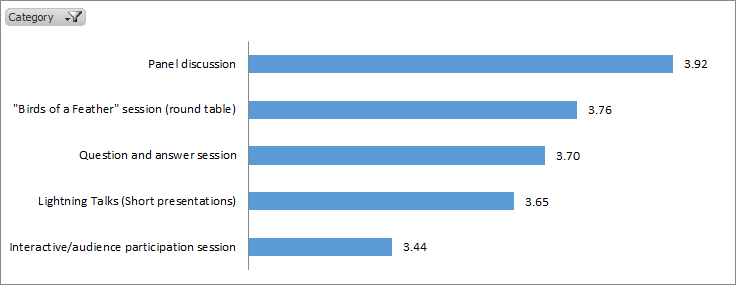
- There is strong interest in panel discussions and ‘birds of a feather’ style events. I am guessing that’s because there’s not enough time to hear from all of the interesting people at PASS.
- DBA topics haven’t changed much since my SQL Server 2005 days: DMVs, performance tuning, monitoring, memory management, HA/DR.
- BI attendees are really interested in the latest stuff: PowerPivot, self-service BI, Azure BI, and Data Mining.
There are many, many different lessons and conclusions you can draw from this data, so I’ll let you speculate about the rest. Enjoy!