Data Science 102: Context
 I have just been accepted to the Data Science certificate program at the University of Washington. This is prep for my ideal job. I love to analyze data and solve hard problems. Lucky for me, that’s in demand.
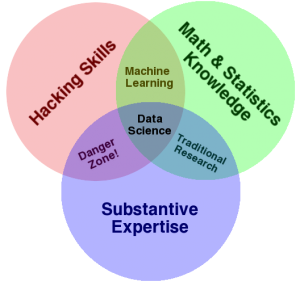
Data scientists have 4 key skills:
- Statistics
- Domain Expertise
- Programming
- Storytelling ability
These skills complement each other. I am sure you’ve been in situations where the key person was someone who knew math, the business, and the data. They are the linchpins of software and IT teams.
Classes start this fall. I will be blogging about the experience here, at DevNambi.com. I know many DBAs and developers who would be good data scientists. I know even more good statisticians and domain experts. What they all have in common is: they are ready for more, but don’t feel ready.
I don’t feel ready either. I am not willing to wait until I am…so here I go!
“Data Science” is a term coined by DJ Patil (@DPatil) and Jeffrey Hammerbacher (@hackingdata). The term became popular after an article, Data Scientist, the Sexiest Job of the 21st Century. It’s a term similar to “webmaster”: it covers multiple roles. It is also not easy, as Joseph Misiti eloquently describes.
Data scientists do 3 things:
- Ask Questions
- Write Code
- Do Math
Math + Code = Machine Learning (ML). It’s such a dynamic field of study that the best sources are often blogs, research papers and conferences instead of books or classes. Here are the resources I’ve found most helpful.
Blogs
- Dataists
- Kaggle’s No Free Hunch
- Pedro Domingos’s Overview of Machine Learning
- Jeremy Kun’s Introduction to Machine Learning
- BigML’s Everything You Want to Know about ML
- Buck Woody’s Setting up a Data Science Laboratory
- Hilary Mason, (blog, @hmason). She has a tremendous ability to make difficult concepts easy to understand. See: An Introduction to Machine Learning in 30 Minutes.
Books
- Machine Learning for Hackers, by Drew Conway (@drewconway) and John Myles White (@johnmyleswhite). * There is also a Python derivative, Will It Python
- Data Analysis Using Open Source Tools, by Philipp Janert
Videos
Conferences
Classes
- Coursera’s Machine Learning class
- Coursera’s Introduction to Data Science
Languages
The most popular languages for machine learning are R and Python. The second tier of popular languages are SQL, Java, Hadoop/Mahout/Hive, and Matlab.
My favorite place to start with R is John Cook’s Introduction to R for programmers.
Python is popular because it’s simple and has more libraries than God. The most popular Python libraries for machine learning are NumPy, SciPy, SciKit-Learn and Pandas.tnu
Algorithms
There are thousands of machine learning algorithms. Luckily for us, a few have risen to prominence. The most popular machine learning algorithms are:
- Decision Trees / Random Forests
- Linear Regression
- Logistic Regression
- Association Rules
- K-Means Clustering
Misc
Machine learning uses a lot of matrix math. It’s quite easy to do matrix math in SQL. Joe Celko has some great examples of matrix math in SQL.
I want to be able to find data, analyze it, and turn it into meaning. Anywhere. Any time. I want to become a data scientist.
The term “data scientist” is not well defined. Many people try to define it precisely. This is ironic, because a huge part of the job is to use data to find knowledge and to measure uncertainty. For all of these people with definitions, I ask: where is your data?
Luckily, there is some agreement about what data scientists do and know. Armed with that basic information, I started studying. I learn the most when I scatter-gather.

Scatter
First, I read a lot of books and blog posts. I watched videos. I started learning different tools and libraries.
The whole time I was careful to take notes, looking for similarities, for patterns, for connections between topics. Who are the key people in each field? What are the most popular concepts, and tools? What lessons and warnings keep cropping up?
Some common skills and tools emerged:
| Skill | Popular Tool |
|---|---|
| Statistics | R. Python. SciPy. NumPy |
| Programming / Scripting | Python. Java. Ruby. Regular expressions. |
| Working at scale (“big data”) | Hadoop. Hive. Pig. HBase. Impala |
| Infrastructure | Linux. AWS |
| Visualization | Tableau. ggplot2. D3.js |
| Storytelling | N/A |
| Domain knowledge | N/A |
| Linear algebra | R. Python. |
| Machine learning | R. Python. Mahout. |
| RDBMS | SQL queries. MySQL. PostgreSQL. SQL Server. |
| NoSQL | Mongo. Cassandra. Redis |
| Files | Log parsing. Regular expressions. |
Gather
After collecting all of this information, I puzzled through what the data meant. The most common lessons are:
- Machine learning techniques (ML) is immensely powerful. Using ML tools is quite easy. Understanding why they work and how they work is hard.
- There are hundreds of ways to analyze data. Data scientists must quickly determine which approach(es) are relevant and which are not.
- Compared with other disciplines, data science does not have the same depth of common knowledge or training. Object-oriented programming or data warehousing are mature disciplines. Data science is very young. Therefore, judgment is key.
- Learn by doing. Pick a question. Find some data. Do some analysis. Communicate it. Reflect. Repeat.
- Learn from your mistakes.
- Learn from other people’s mistakes
- Some of the brightest data scientists speak publicly, have blogs, and are on Twitter. Learn from them.
- This is serious work, but also a lot of fun. Enjoy yourself.
The more I learn about this work, the more I love it.
We learn from other people. We often learn from others with similar interests. Who are they? How do we find them?
I am studying at the University of Washington to become a data scientist. My first course, Introduction to Data Science, started a few weeks ago. All of the students completed a survey. Our professor, Dr. Bill Howe, made the anonymized results public. I put the data and my analysis on GitHub for anyone to see.
I am interested in three questions:
- What data science topics are students most interested in?
- How similar are students’ preferences?
- How should we group students together?
Pick The Winner
Which data science topics are the most popular? Let’s use boxplots to find out; they are an effective way to summarize this data.
This can be done in 7 lines of code in R:
survey <- read.csv(file="ReshapedResponses.csv", header=TRUE)
survey[,3] <- survey[,3]+2 #go from range (-2 to 2) to (0 to 4)
orderedSurvey = with(survey, reorder(Question, Response, median))

p <- ggplot(data=survey, aes(x=Response, y=orderedSurvey))+
  geom_boxplot(notch=TRUE)+
  labs(x="Importance", y="Question")
plot(p)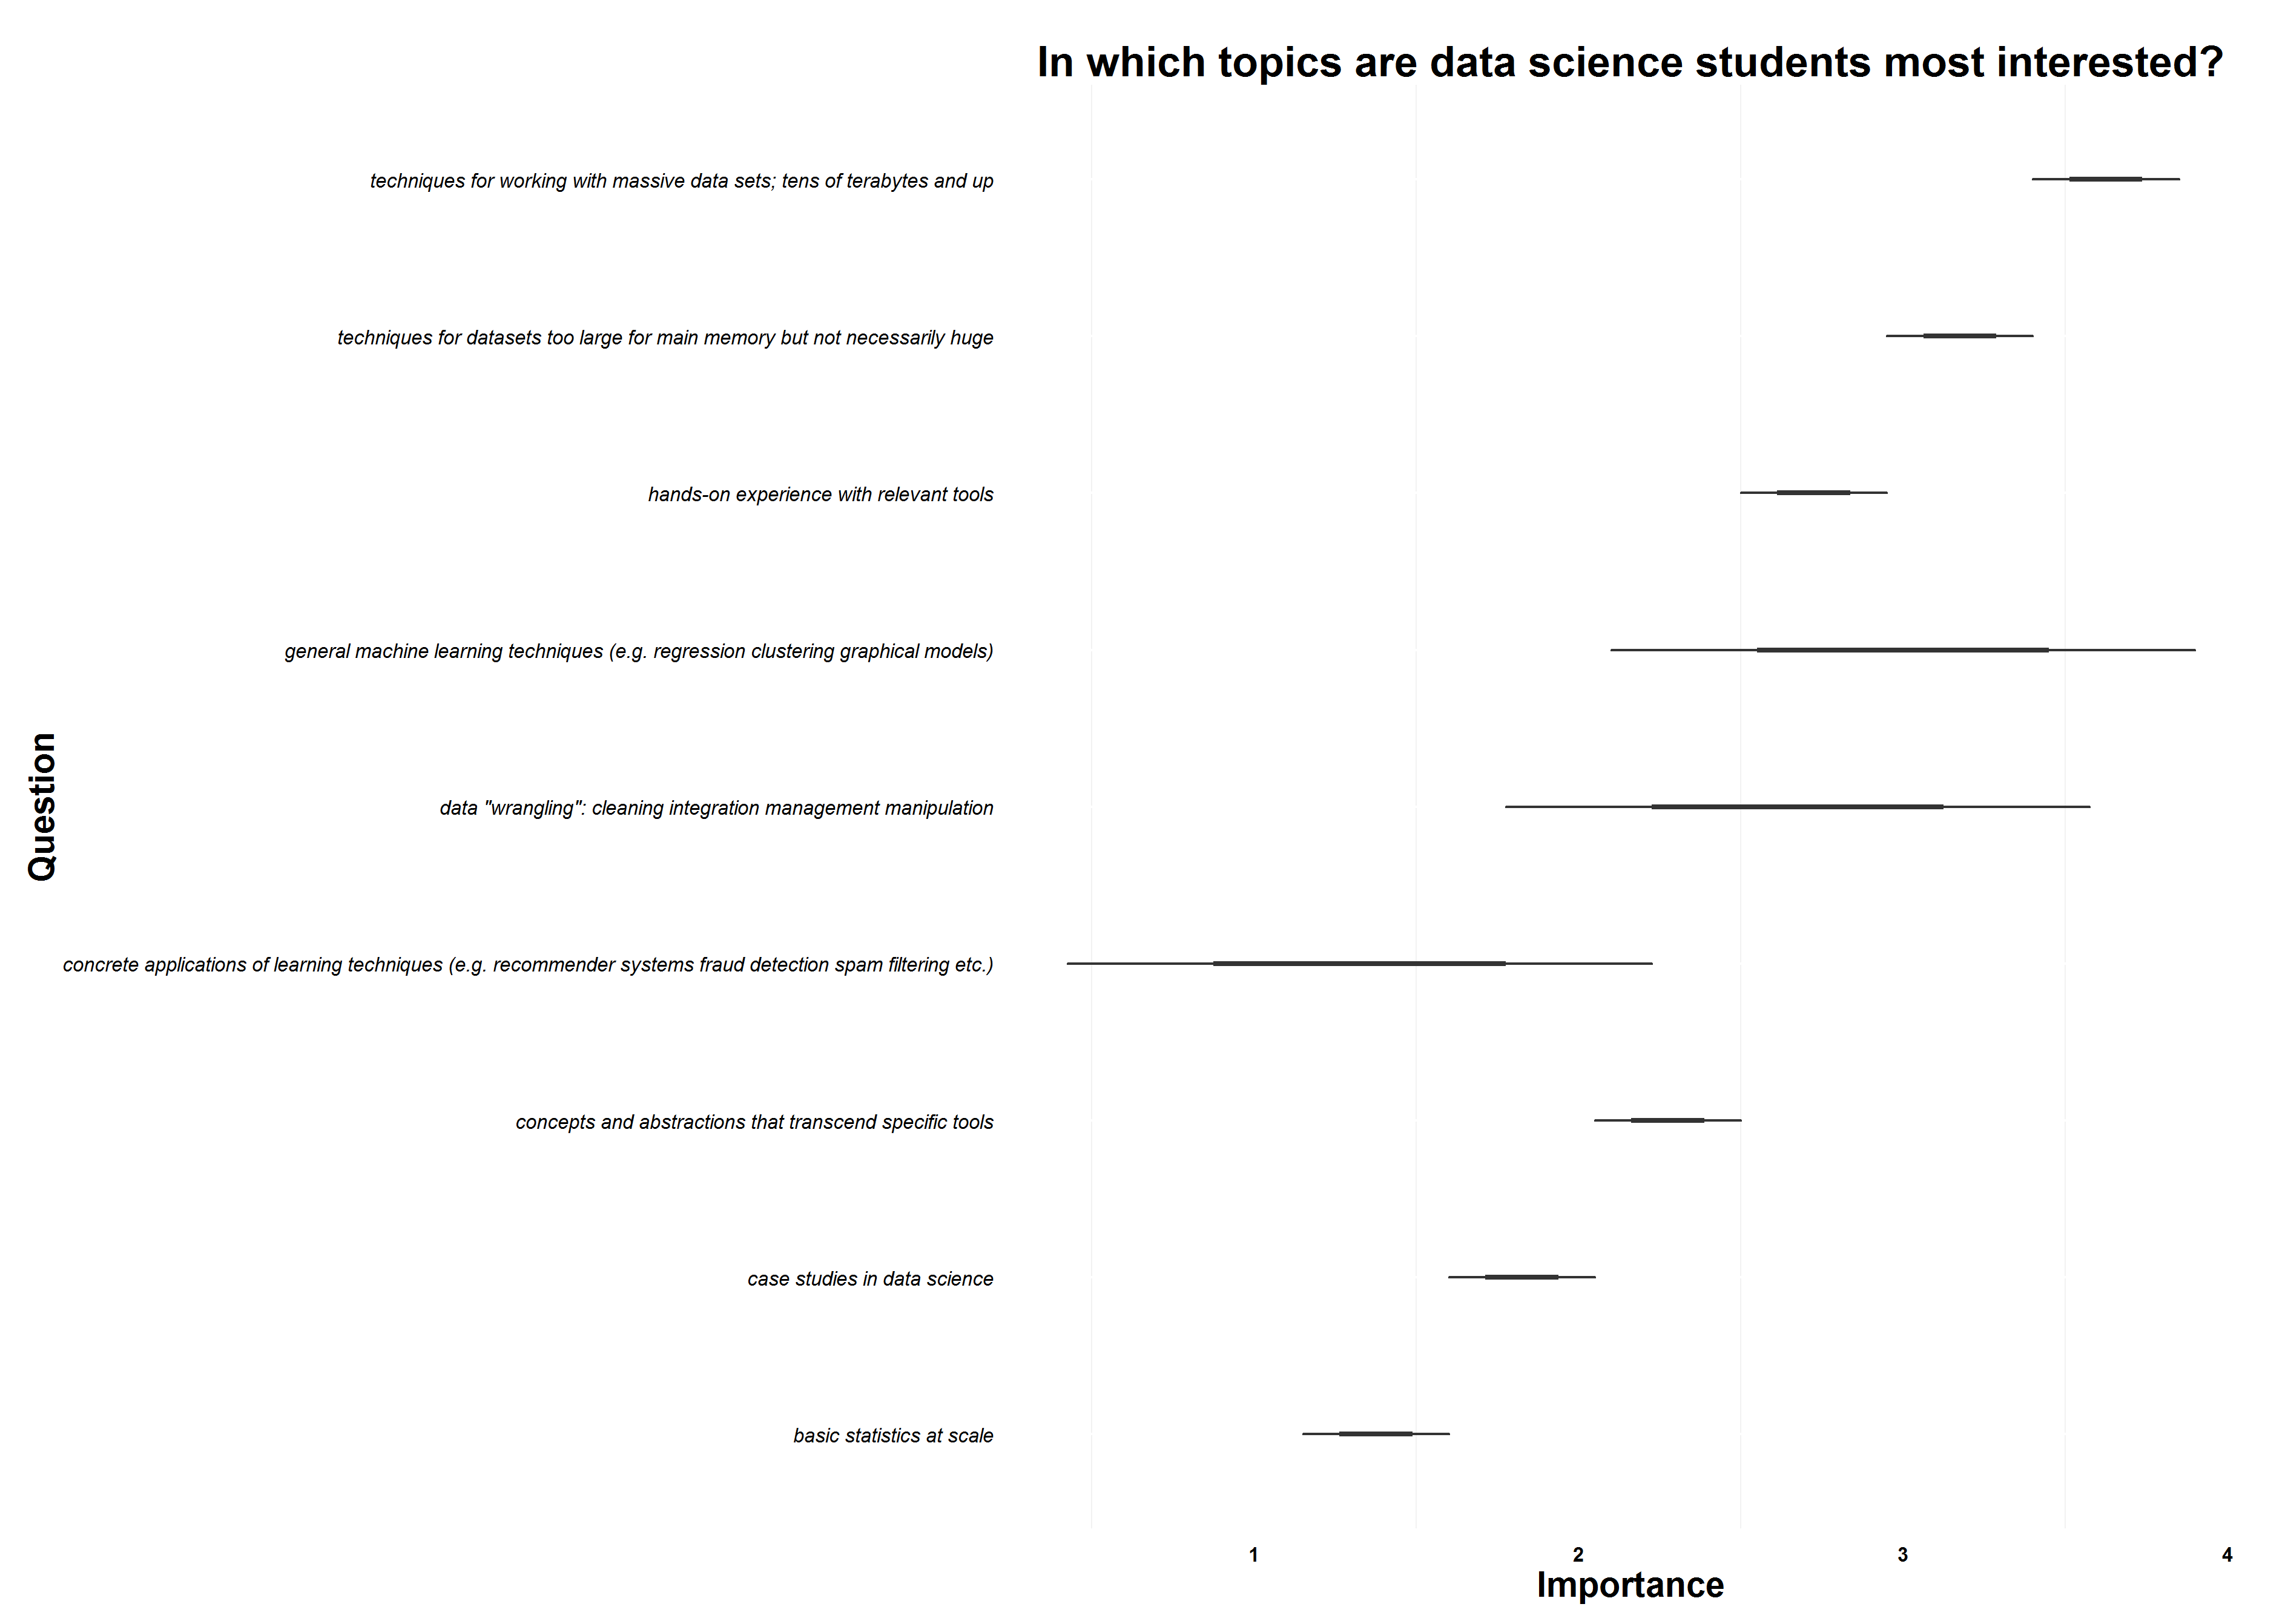
The results are clear. My fellow students want to learn about techniques to work with “big data” or “fairly big data” in both practical and abstract ways. There is also a desire to understand machine learning.
Am I like You?
My fellow students are a diverse group. How similar are our learning preferences?
If we pick a random student, S1, how similar are their preferences to another student’s, S2? If we can calculate a single metric to measure similarity for one pair of students, we could calculate that metric for__ _all _pairs of students. This is a Euclidean distance problem, and it comes from problems solved using clustering algorithms.
We’ll be using R again, again writing 7 lines of code:
survey <- read.csv(file="surveyresults.csv",header=TRUE,sep="\t")
survey.clean <- survey[,5:13]+2 #go from range [-2 2] to [0 4]
survey.matrix <- as.matrix(survey.clean) #create a matrix
survey.dist <- dist(survey.matrix) #compute matrix distance
survey.mds <- cmdscale(survey.dist) #compute mds of the distance
survey.mds.df <- as.data.frame(survey.mds) #get a table again
qplot(data=survey.mds.df, x=V1, y=V2) #plot the results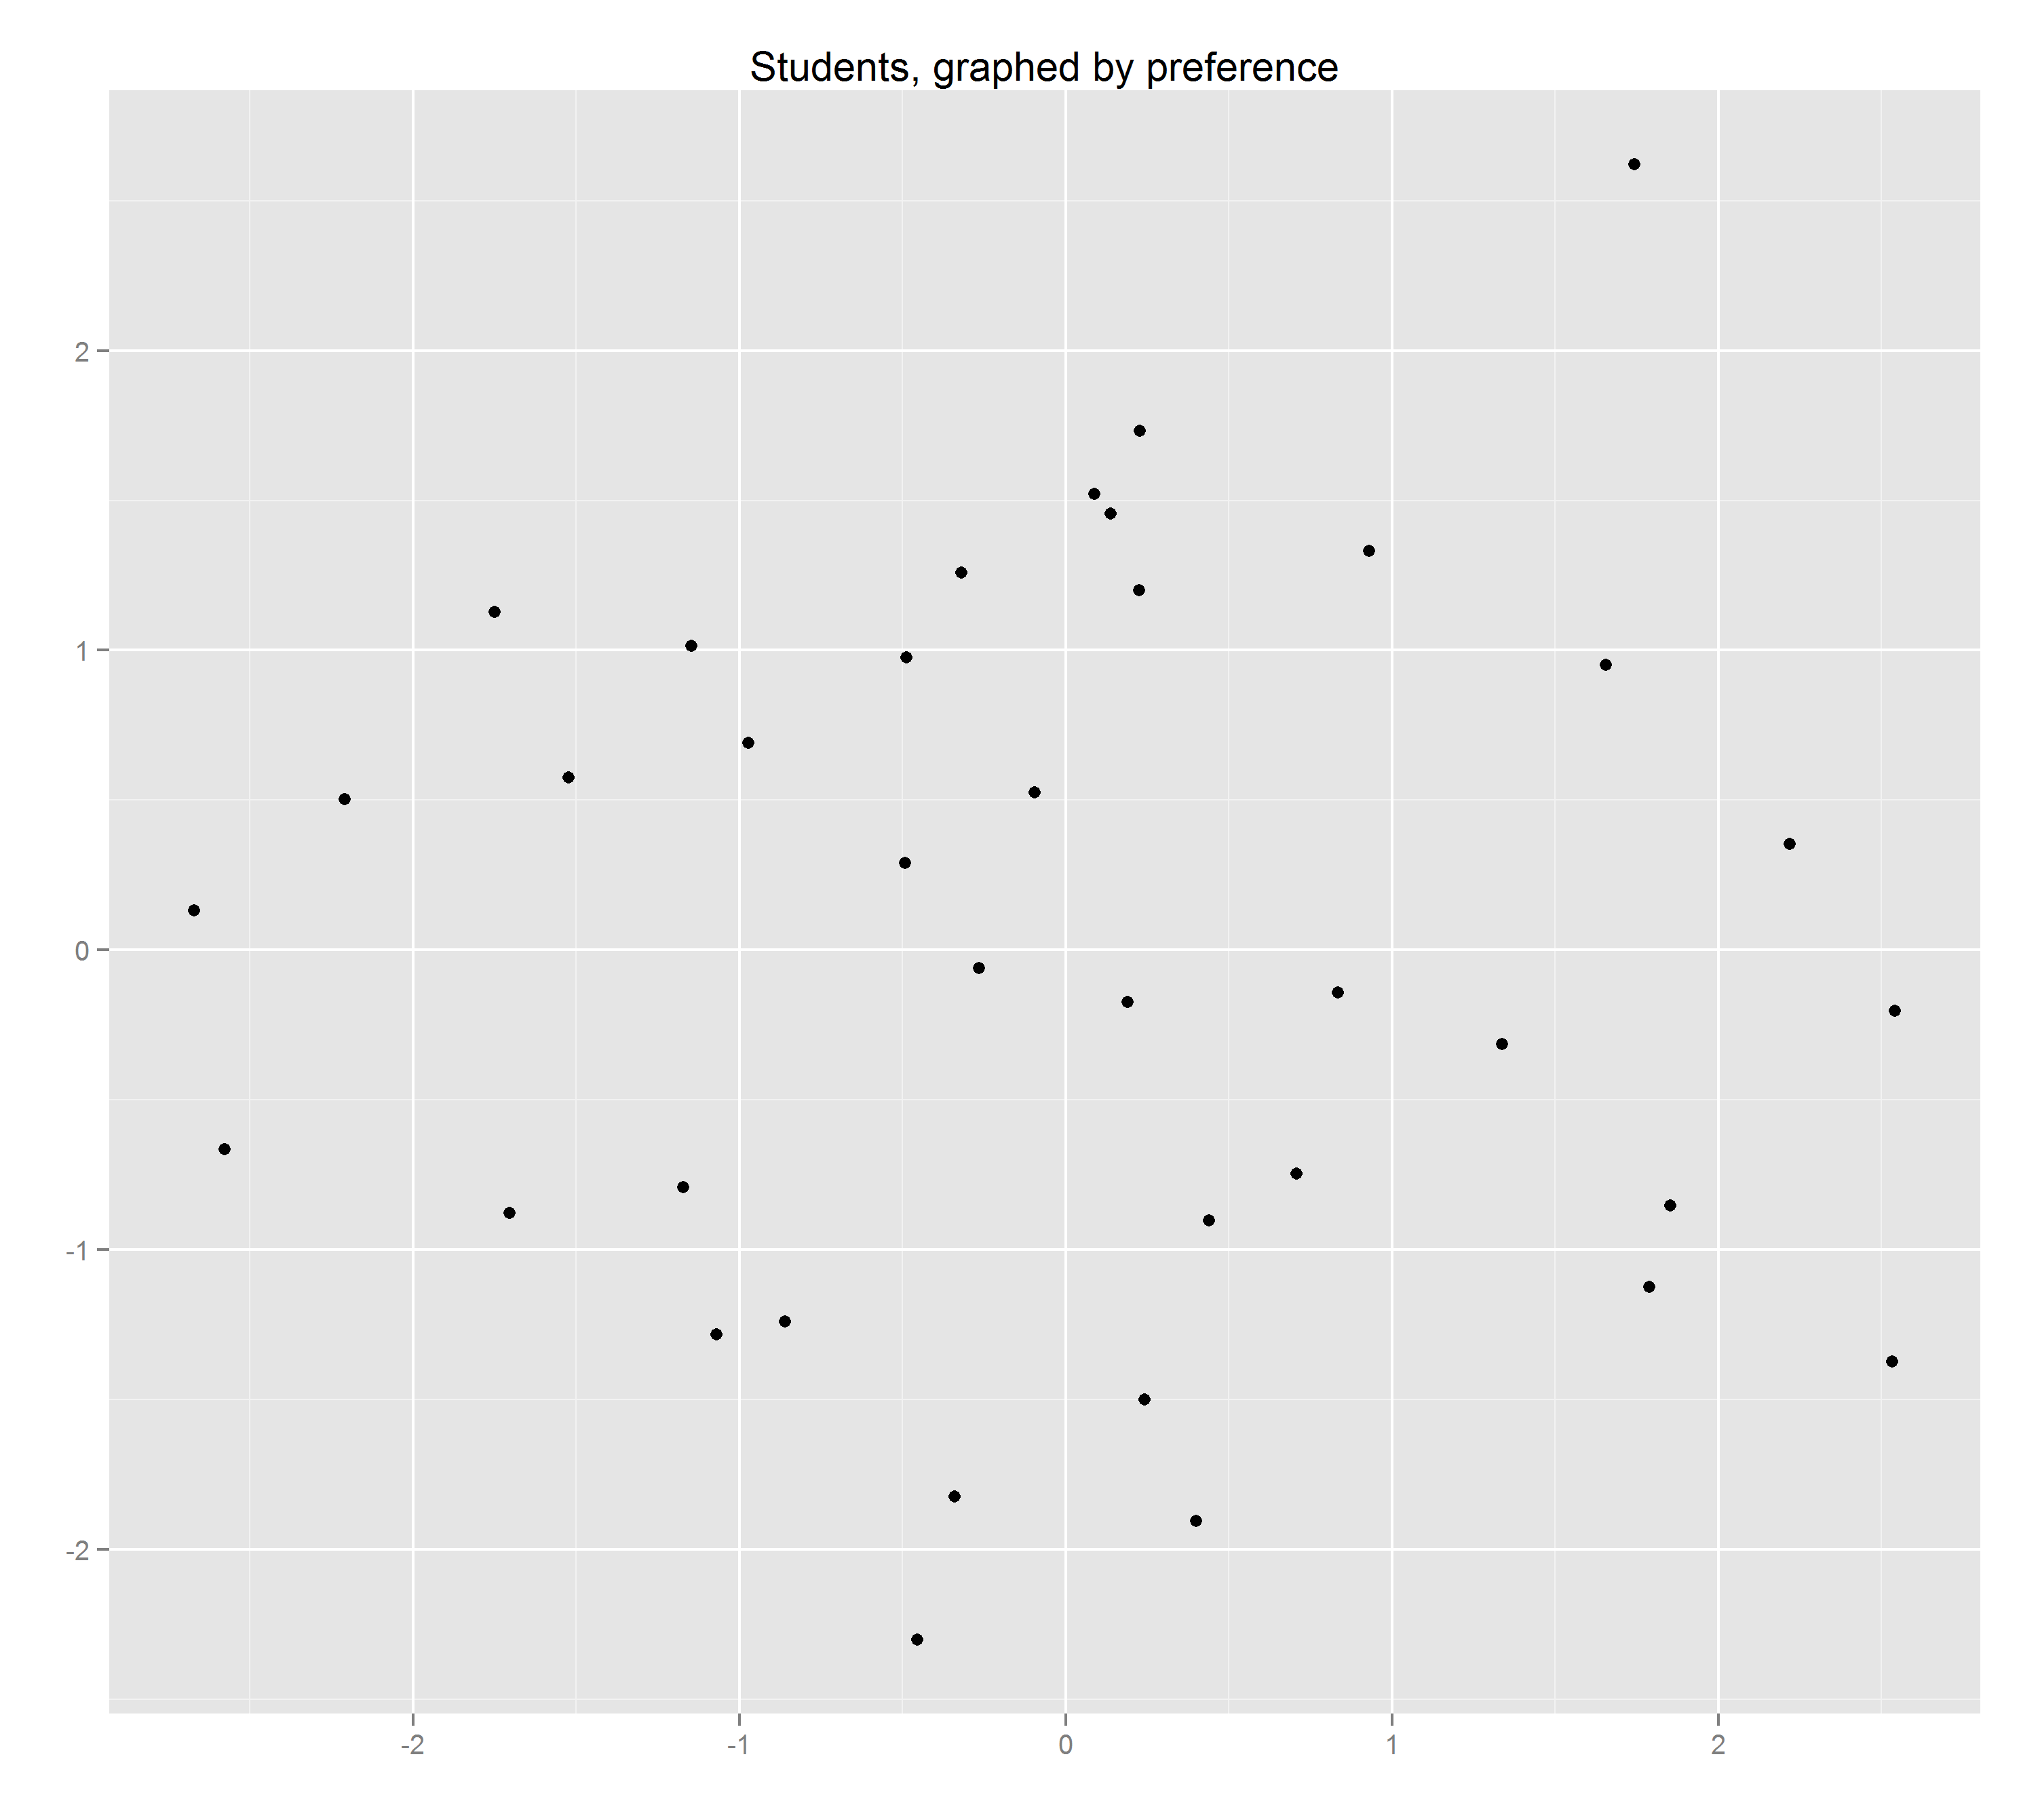
The result shows each student’s learning preference compared to their classmates’.
Finding Niches
Which groups of students in that chart have similar learning preferences? How do we find those groups? How big should the groups be?
Time for another algorithm: k-means clustering. This algorithm is used to find the k best clusters for a set of points. For example, if k=3, it would group all the data into 3 clusters.
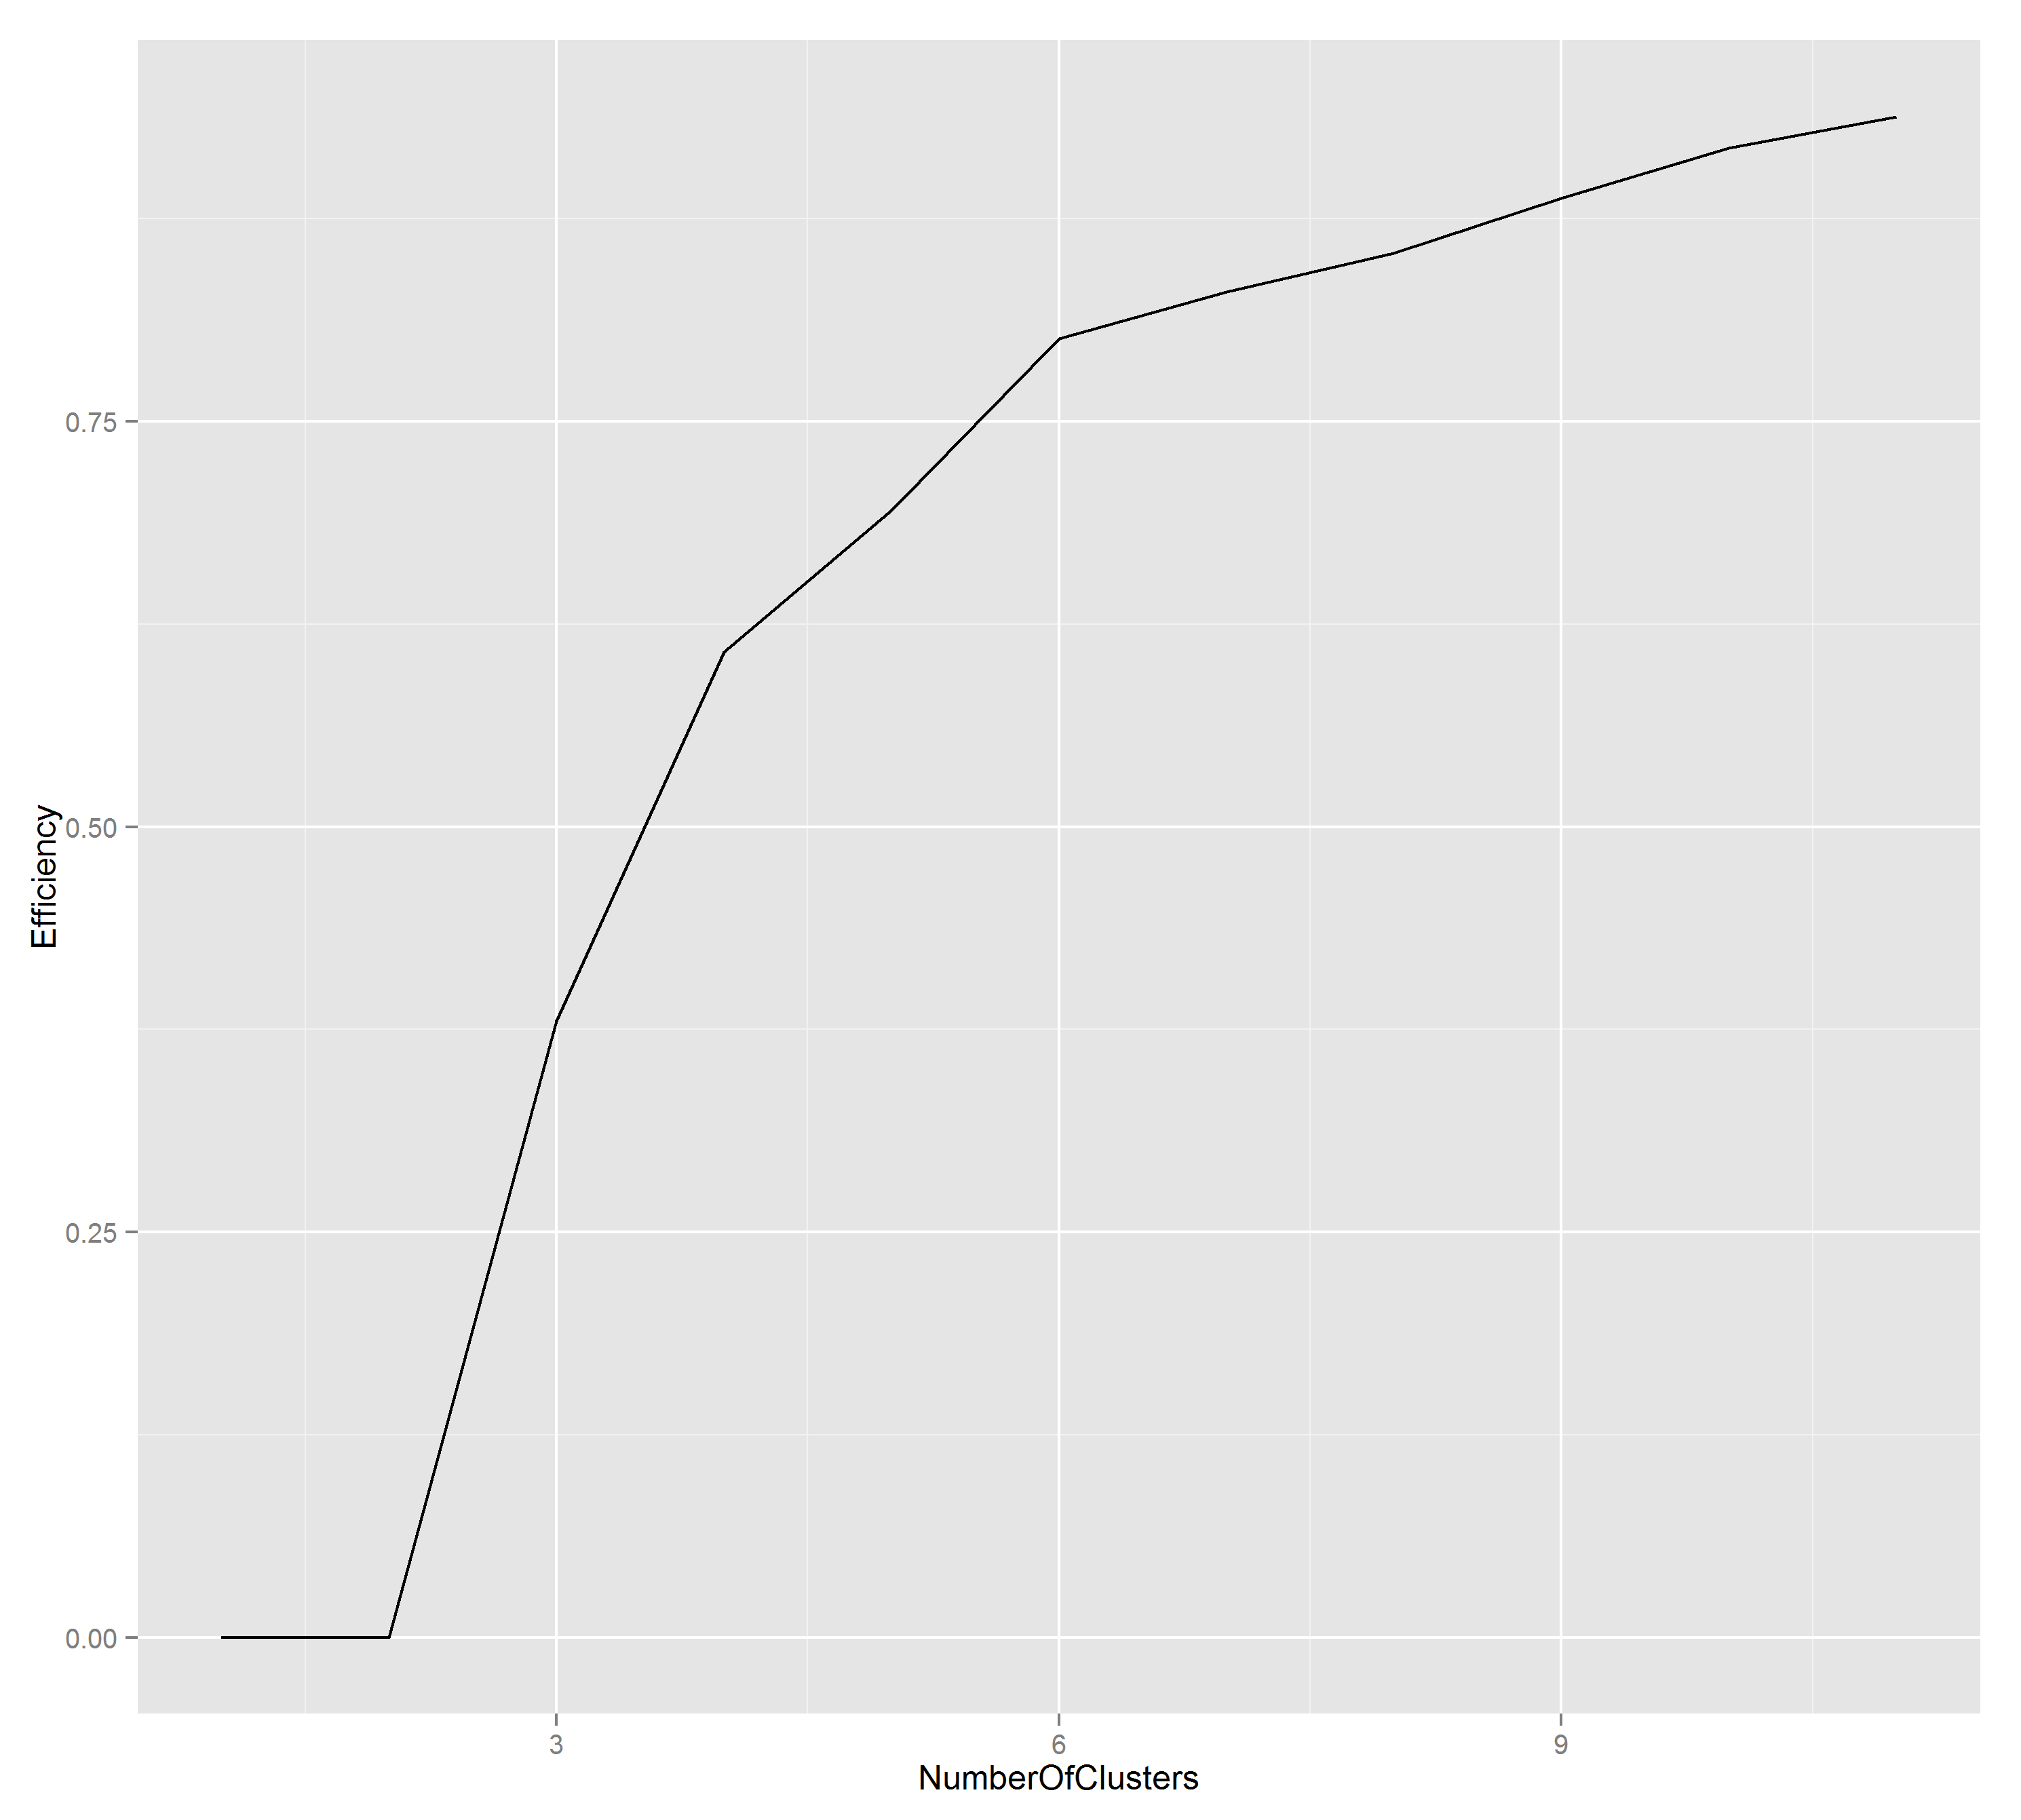
Since k is not chosen automatically, we need to find a good value for it_._ There are a few different approaches to consider. We’ll use the elbow method: look at a graph of k vs efficiency, and identify where the line bends (like an elbow). It’s at k=5.
Great! Let’s see the clusters. We can do that with 2 lines of R code:
survey.kmeans <- kmeans(x=survey.mds, centers=5)
qplot(data=survey.mds.df, aes(x=V1, y=V2, color=factor(survey.kmeans$cluster)))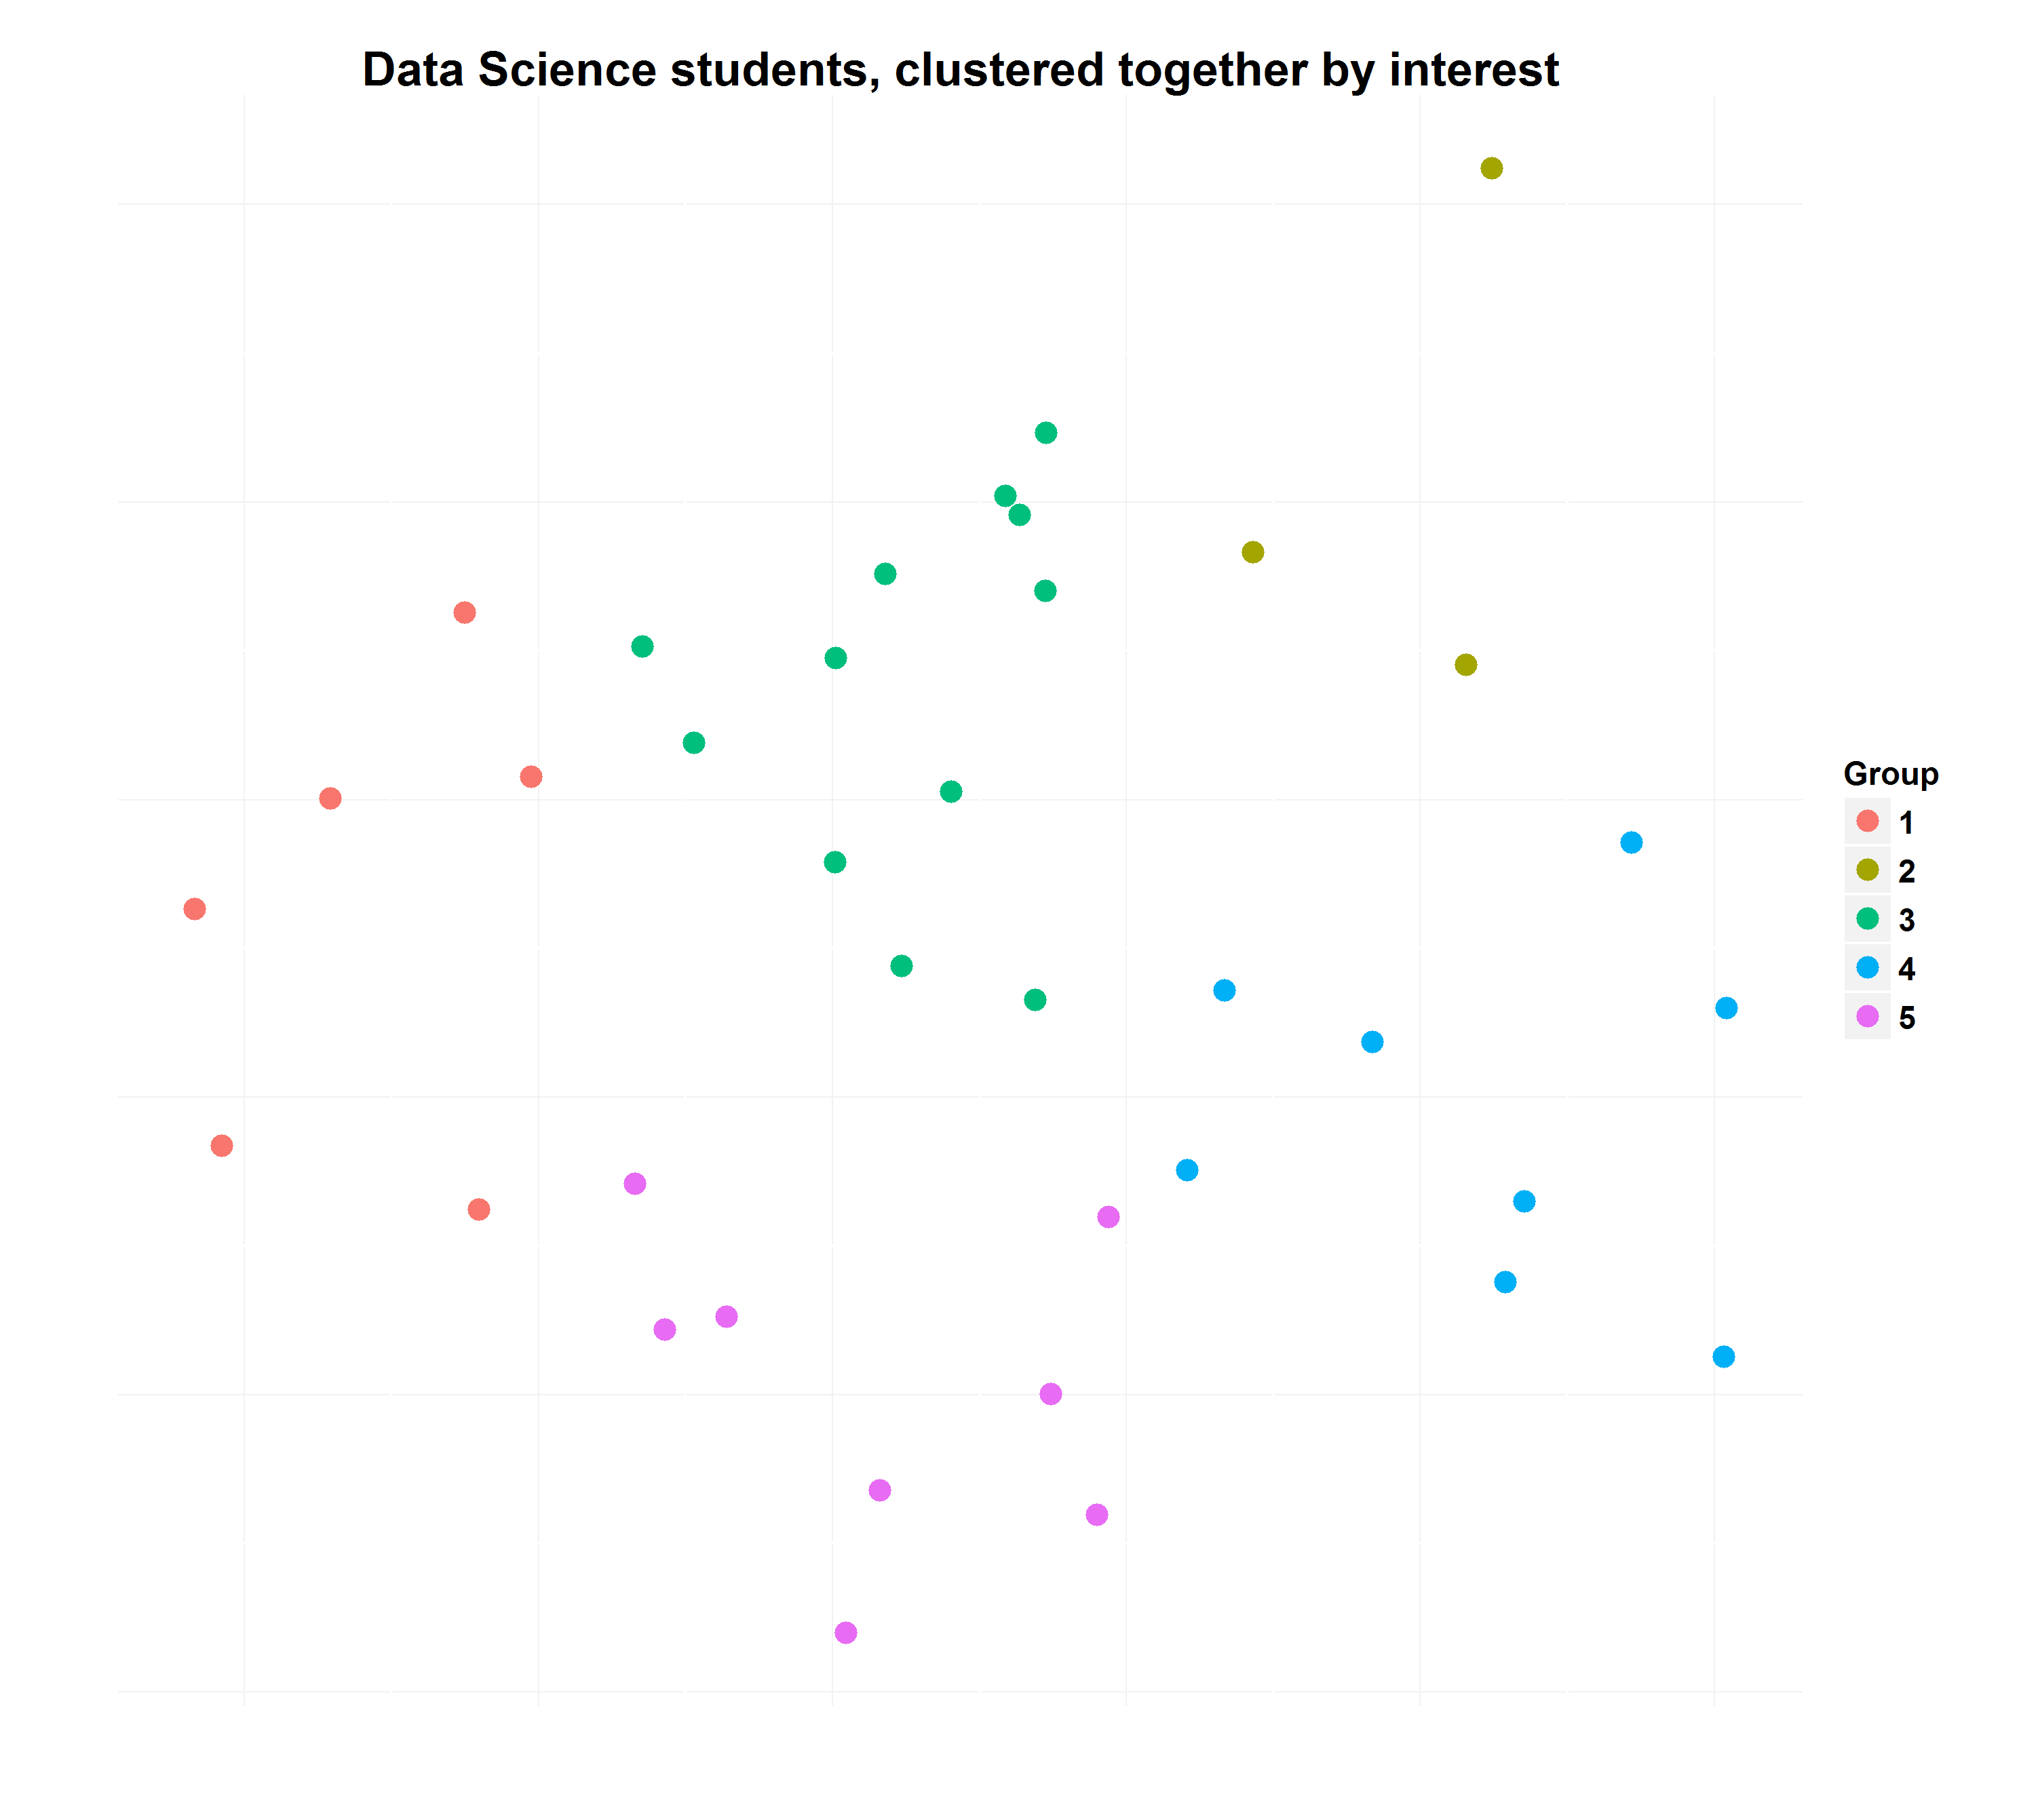
We can see there are 5 groups. They are 3, 6, 8, 8, and 12 people in size, and cover ~80% of the variation in learning preferences between students. That’s pretty good. If this data wasn’t anonymous, a teacher could use it to group students together with similar interests. Success!
Resources and Next Steps
This may seem intimidating for IT professionals or developers. It isn’t. There are fantastic resources available. You just need data, a computer, time, and curiosity.
I have progressed this far using only:
- A laptop
- Software - RStudio
- Software - a web browser, StackOverflow and Wikipedia
- A Coursera class on R
- Book - Machine Learning for Hackers
- Book - Data Analysis Using Open-Source Tools
- Book - ggplot2 (for creating R graphics)
- Data - whatever I can find.
- 4-15 hours a week for the last 2 months.
What’s next? More data. More algorithms. More questions. More learning.
Published 18 June 2012