Find Good Schools Using Data
This is a (long) blog post analyzing the quality of schools using data. I’ll go over how to identify a good school, and what factors influence the quality of a school. Finally, I’ll test some common wisdomrumors to see if they are accurate.
Background

“The mind is not a vessel to be filled but a fire to be lit” - Plutarch
Parents care about their children, and sacrifice to help them advance in the world. One of the biggest expenses is putting their child into a good school, often by moving near one. They believe, rightly, that a great education enables their children to fulfill their potential.
Unfortunately, there is no simple way to find a good school. Parents gather what information they can from family, friends, ‘top 100’ articles, etc. Let’s use data instead.
What is Success?
What is the definition of a good school? A good school teaches children to identify and achieve their goals in life. That means a school will instill confidence, fluid intelligence, civic engagement, street savvy, and a broad base of knowledge in its students. Sadly for data scientists and analysts, these traits are hard to quantify.

Let’s use a narrower definition: a good school is one that prepares students to successfully complete college and start a career. A study by the US Department of Education found that intense classes are the best predictor of college completion. These classes are often called Advanced Placement, International Baccalaureate, or Honors classes. We can use AP test scores and counts as a metric to measure the quality of a school.
A good school should exhibit the following behavior:
- A high percentage of students that take an AP test do well, and receive a good score.
- Students take several advanced classes, not just one. This is a sign of intellectual breadth as well as depth.
- A high and/or increasing percentage of students take advanced classes over time. The school is improving over time.
Show Me the Data!
Now that we have our goals, we need data! I collected data for every school in Washington state. This includes AP test counts, scores, SAT scores, school budget information, teacher counts, and teacher evaluations. However, people are influenced by their environment. I have also collected neighborhood data for school zip codes covering factors such as crime rates, parents’ education levels, urban density information, and so on. This gives us 655 high schools to use for our analysis, with over 30 variables for each school.
Let’s start with the obvious question: which schools are the best in the state? I have defined a single metric that defines success: High Achiever %. It is the percentage of students in the school that take an AP test _and _achieve a good score in the test.
We Have A Winner
At the very top is Newport High School , which sends 52% of its students to AP tests, and 79% of them achieve a good score, for a High Achiever % of 41.2%. The runner up is Interlake High School, which sends 48% of its students to AP tests, and 77% achieve a good score, for a High Achiever % of 39.6%.
It is not clear why those schools are the best. It’s also not clear whether they are the best for the price, since they are in very expensive neighborhoods.
There’s a lot of variation there, but you can see that different schools have dramatically different High Achiever % values. Let’s look at the data a little differently: by measuring High Achiever % and Tests Per Student independently. Ideally a good school would have both.

As we can see here, there appears to be a relationship between High Achiever % and Tests Per Student. That makes sense; a school that can educate its students extremely well in one subject is likely to do so in multiple subjects.
One common predictor of school quality is the education level of its students’ parents. This also correlates highly with household income. This leads to a common result: housing near good schools is expensive. Let’s look at that relationship more closely.
In the next post, we will look at the relationship between a school quality and income. Are good schools always in expensive neighborhoods? Find out!

“You’ll love this expensive neighborhood. It has great schools” - Every Realtor, ever
HOUSE PRICES
When parents buy a house, a ‘good neighborhood’ means ‘near good schools’. Parents will spend as much as they can afford to be near a good school. Let’s see if it’s a good idea to spend more; below is a graph of schools’ High Achiever % compared with house prices.

There is a rough trend where school quality increases as house prices increase. Let’s see how much of a trend there is. A little linear math (least squares’ regression) produces this equation.
High Achiever % = Median House Price * 0.0000002439 - 0.0274391
R^2 = 0.259, SSE = 0.818, MSE = 0.00223, p-value = < 0.0001
An R² value of 1 means two variables are perfectly correlated. An R² value of 0 means no correlation. Here there is a correlation of 0.259. The p-value is very small (less than 0.05), meaning that the linear regression is probably significant. So, we’re not grasping at straws.
We’re interested in schools with a high High Achiever % that is not due to house prices. This is also known as the _residual. _
High Achiever % Not Due To House Prices =
High Achiever %  - High Achiever % Due to House Prices (equation)

This is the same data as above, except without the influence of house prices. Here we can see which schools are good deals; they have positive values.
For example, Mercer Island high school has a 16% High Achiever value, which is quite good. However, it is a very low score for the cost, because the median house costs over $1 million. Therefore its residual value is negative (it’s not worth the price). In contrast, Friday Harbor high school has a 27% High Achiever value, with a median house price of around $360K. It’s a far better deal.
Parents could use this data to make informed decisions about where to move. For example, we can see that houses over $400K don’t provide much (if any) additional improvement in school quality.
Rent Prices
What if we want to rent, instead of buying? Let’s look at school quality compared to rent price:

There is a correlation between rental prices and school quality. More linear math, and we find:
    High Achiever % = Average Rent * 0.0001197 -0.0684526
    R^2 = 0.247, SSE = 0.724, MSE = 0.00282, p-value = < 0.0001
There is still a correlation, but it’s weaker compared to house prices (an R² value of .247 instead of .259). Still, we can use the linear equation to plot the residual, looking for good deals:

The correlation (R²) between rent and school quality is weaker than between house prices and school quality. There are more potential deals when renting instead of buying.
The Takeaway: Don’t assume schools are better because they’re in a pricier neighborhood; that’s not always true. And consider renting instead of buying.
WARNING: Correlation != causation. We’ll see correlations between housing prices and school quality. This does not mean school quality changes because of the price of a house. Children don’t become better students because their kitchen has granite countertops..
What other factors influence school quality? Let’s investigate further…
Schools produce data. Thus far we have looked at school quality, and its relationship to house prices. What else affects the quality of school? School size? Parents’ education? Teacher salaries? Gender ratios? Teacher ratings?
Can we use this knowledge to make better decisions?
Brains > Algorithms
First, look at data. A common challenge in data analysis is knowing the appropriate methods to use. There are thousands of statistical and machine learning algorithms, and none of them are appropriate for all situations. Let’s see some density plots of different variables:
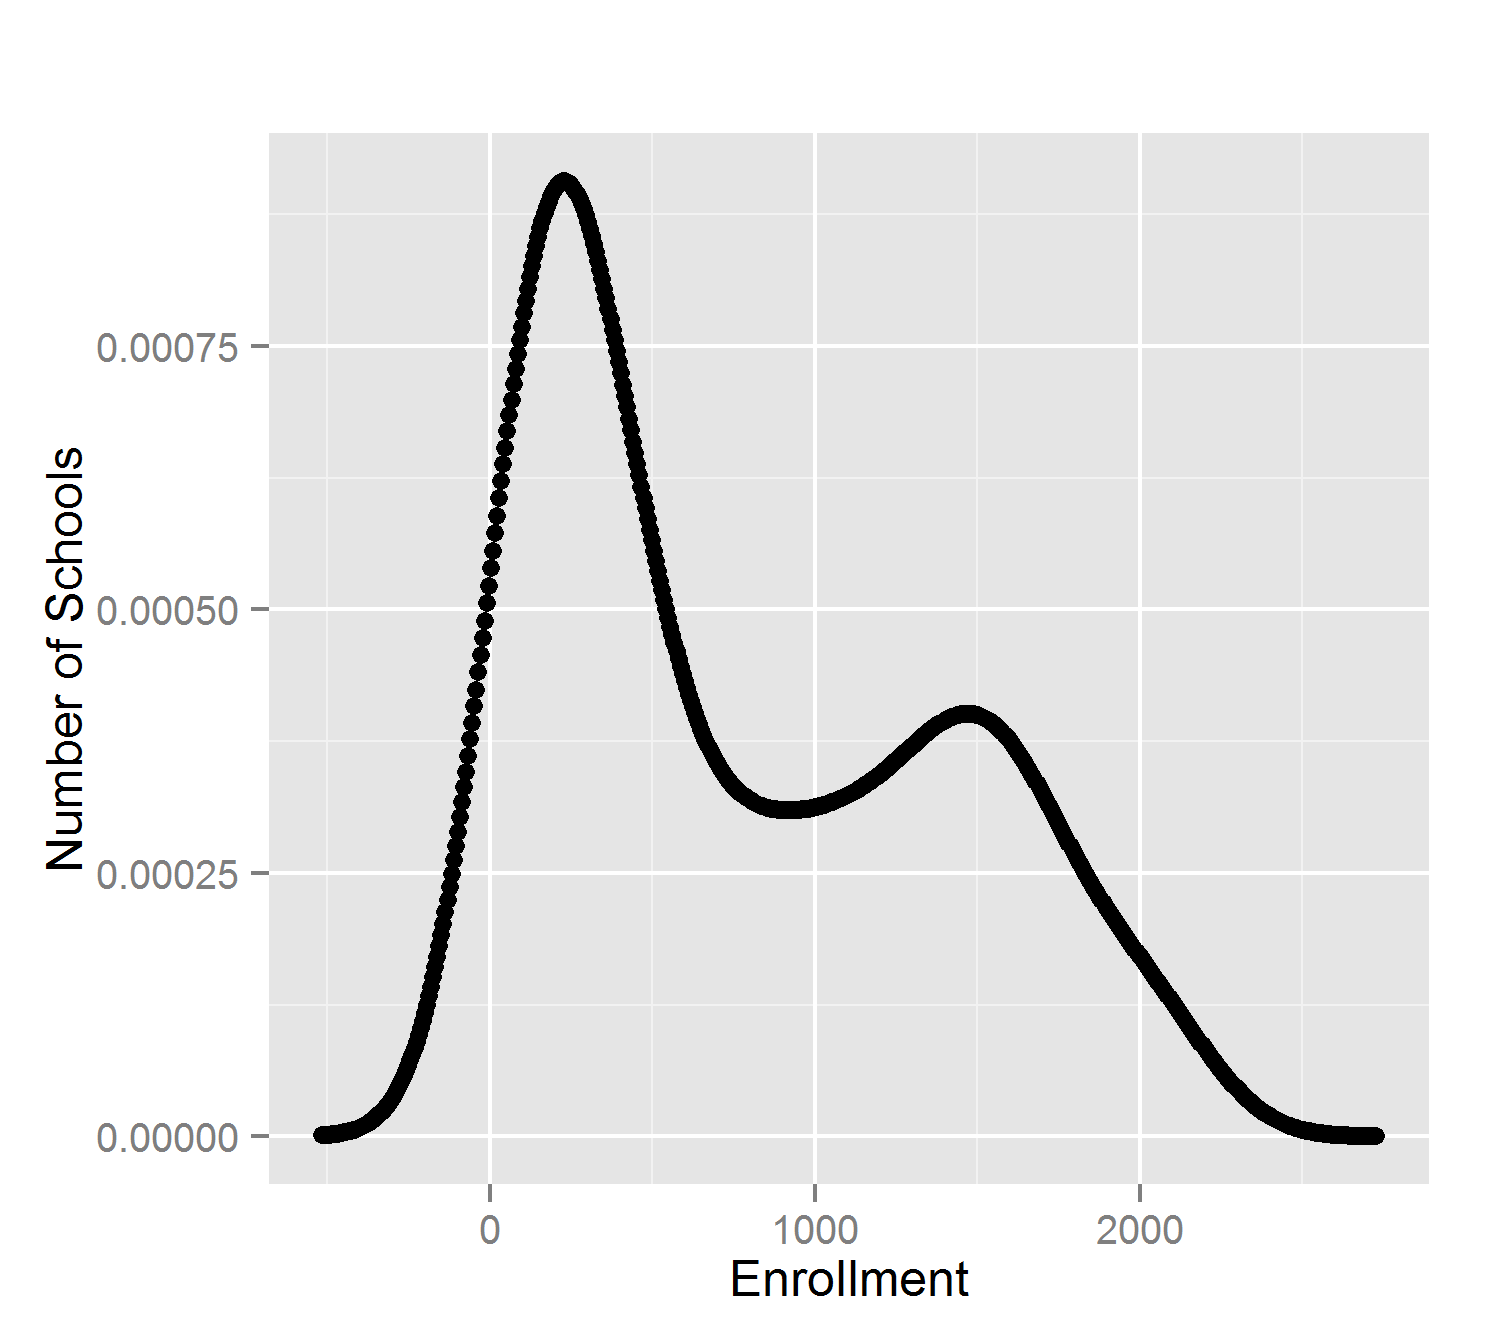
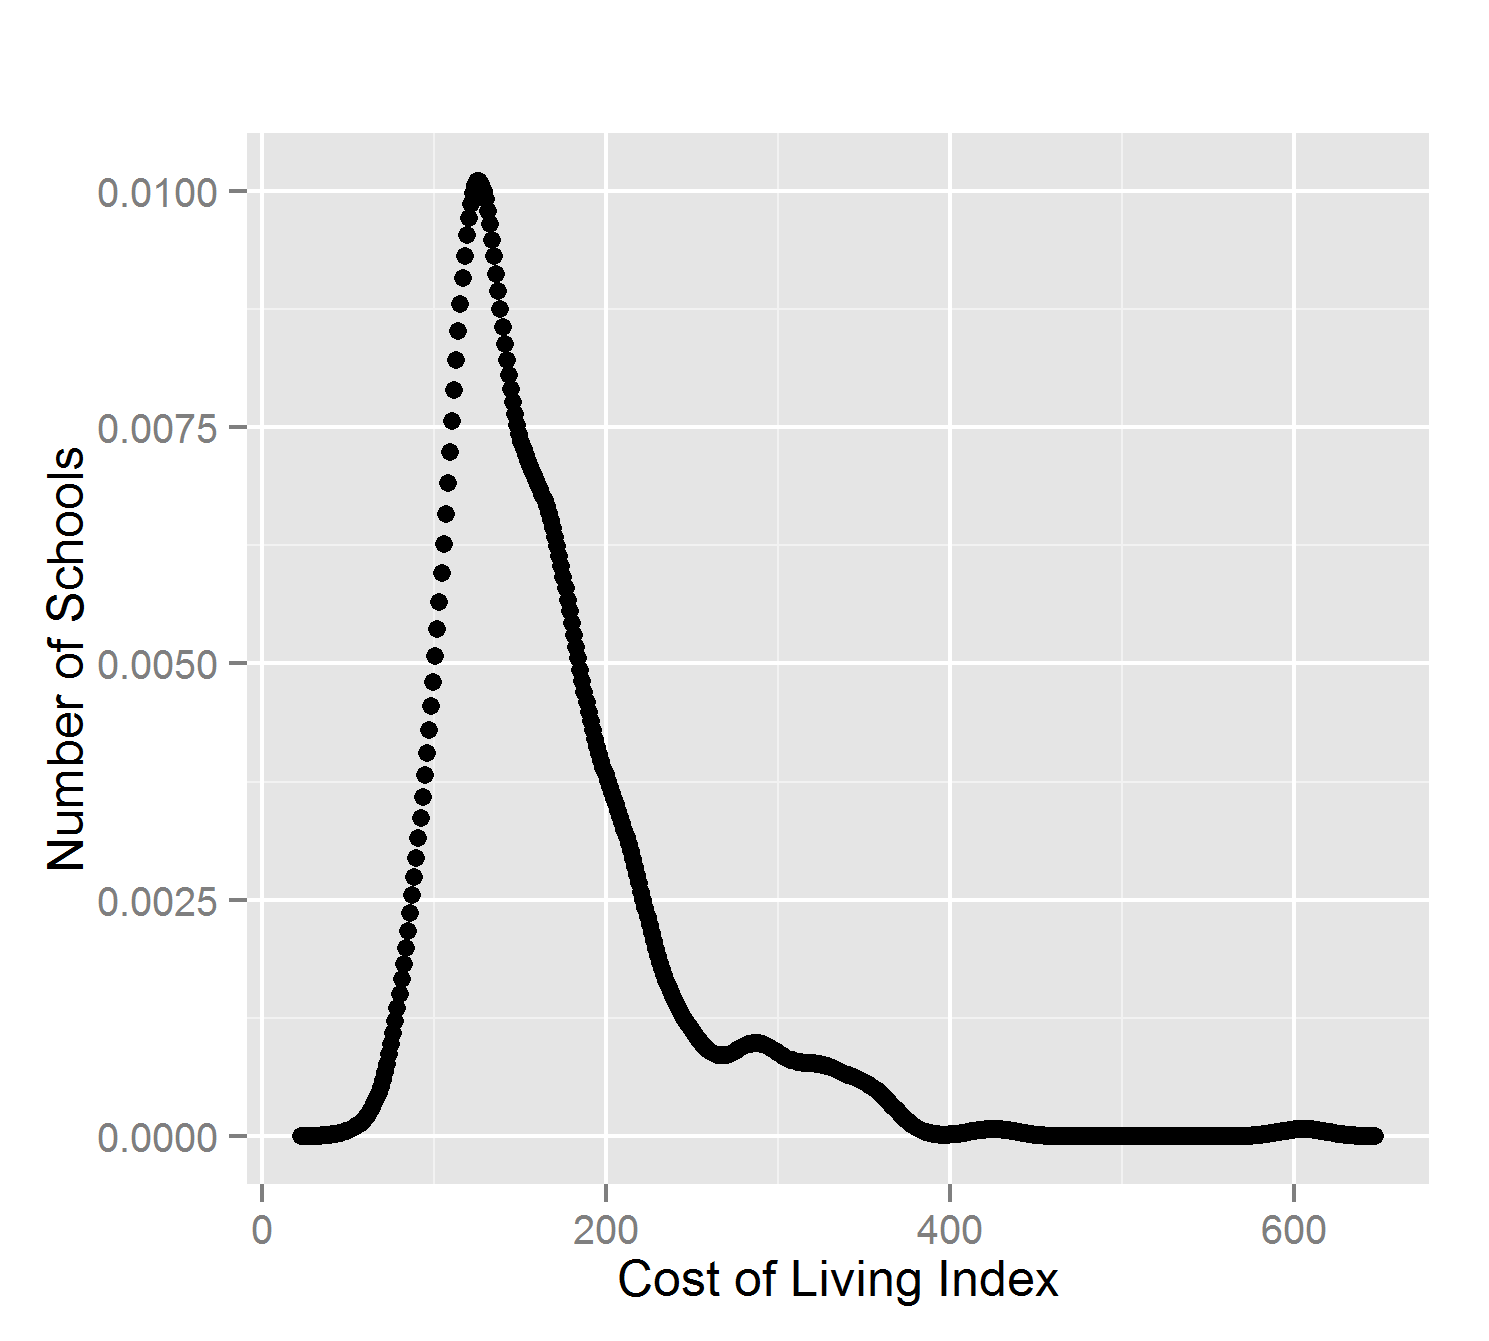

What do we see? High schools appear to come in two different size ranges. The cost of living has a positive skew. School budgets are relatively similar.
None of these attributes follow a ‘normal’ (Gaussian) distribution of values. The most common statistical methods are therefore inappropriate: mean, standard deviation, and Pearson’s correlation.
Let’s see which variables correlate well with High Achiever %. We can’t use Pearson’s correlation here, so we’ll use Spearman’s Rho instead.
Some variables have a strong correlation, such as parents’ education levels. Others don’t, such as the age of the school neighborhood.
We must remember that correlation does not imply causation. However, the lack of a correlation does imply a lack of causation. If two variables are not correlated then there a causal relationship is unlikely, if not impossible.

Peekaboo, How Good Are You?

Let’s use a combination of factors to predict the quality of school. We’ll use a machine learning algorithm, Random Forests, an ensemble method of decision trees with good behavior for this class of problem.
A few lines of code produce a model to predict school quality. Let’s see how closely the predicted (green) values compare against the actual (red) values:
Good, but not perfect. It is impressive that we can predict school quality using only demographic and budget data. After all, we don’t have any information about teacher skill, different teaching techniques, or the students themselves.
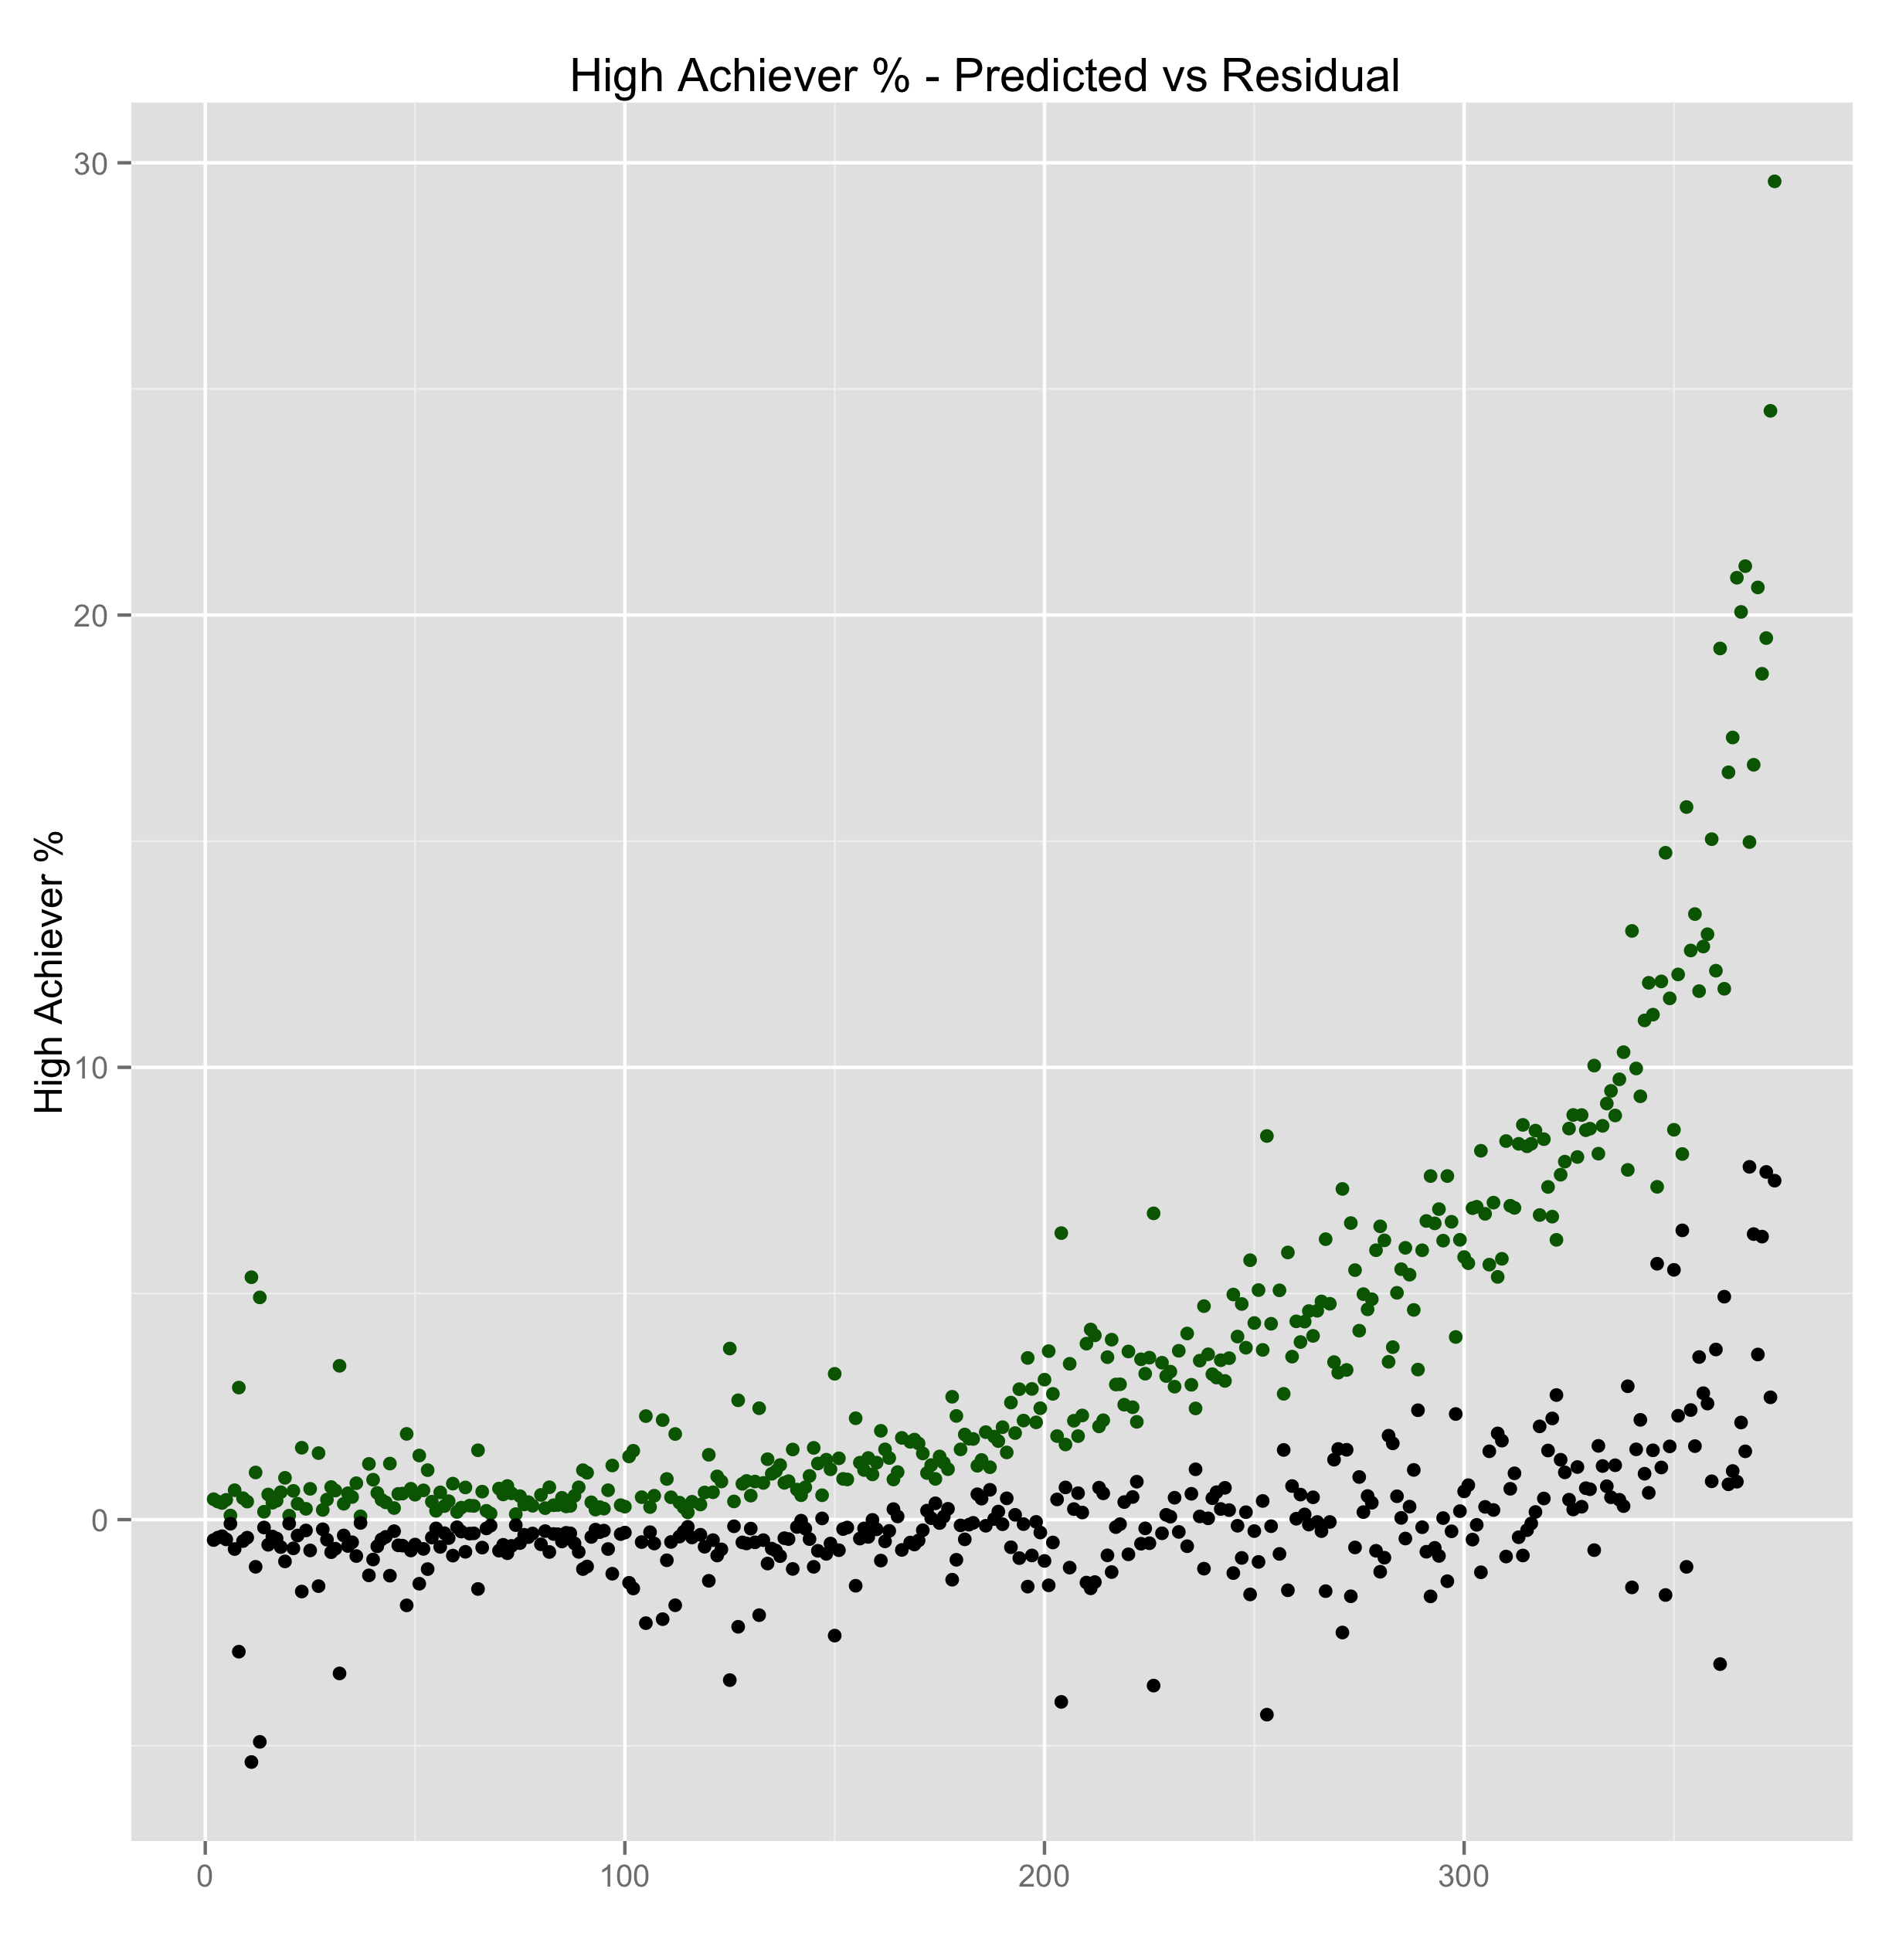
Let’s plot the residual (actual - predicted), values, in black, against the predicted numbers, in green. The residual numbers contain variation that is not explained by demographics or budgets. They suggest that unobserved variables are involved, like teacher skill or student aptitude.
Let Data Be Your Guide
Analysis thus far suggests school quality is influenced by demographics and budgets. These are factors a school cannot control.
Let’s use that to our advantage. Groups of schools with similar demographics will still have different levels of quality. They can learn from each other, since schools in similar situations have done well.
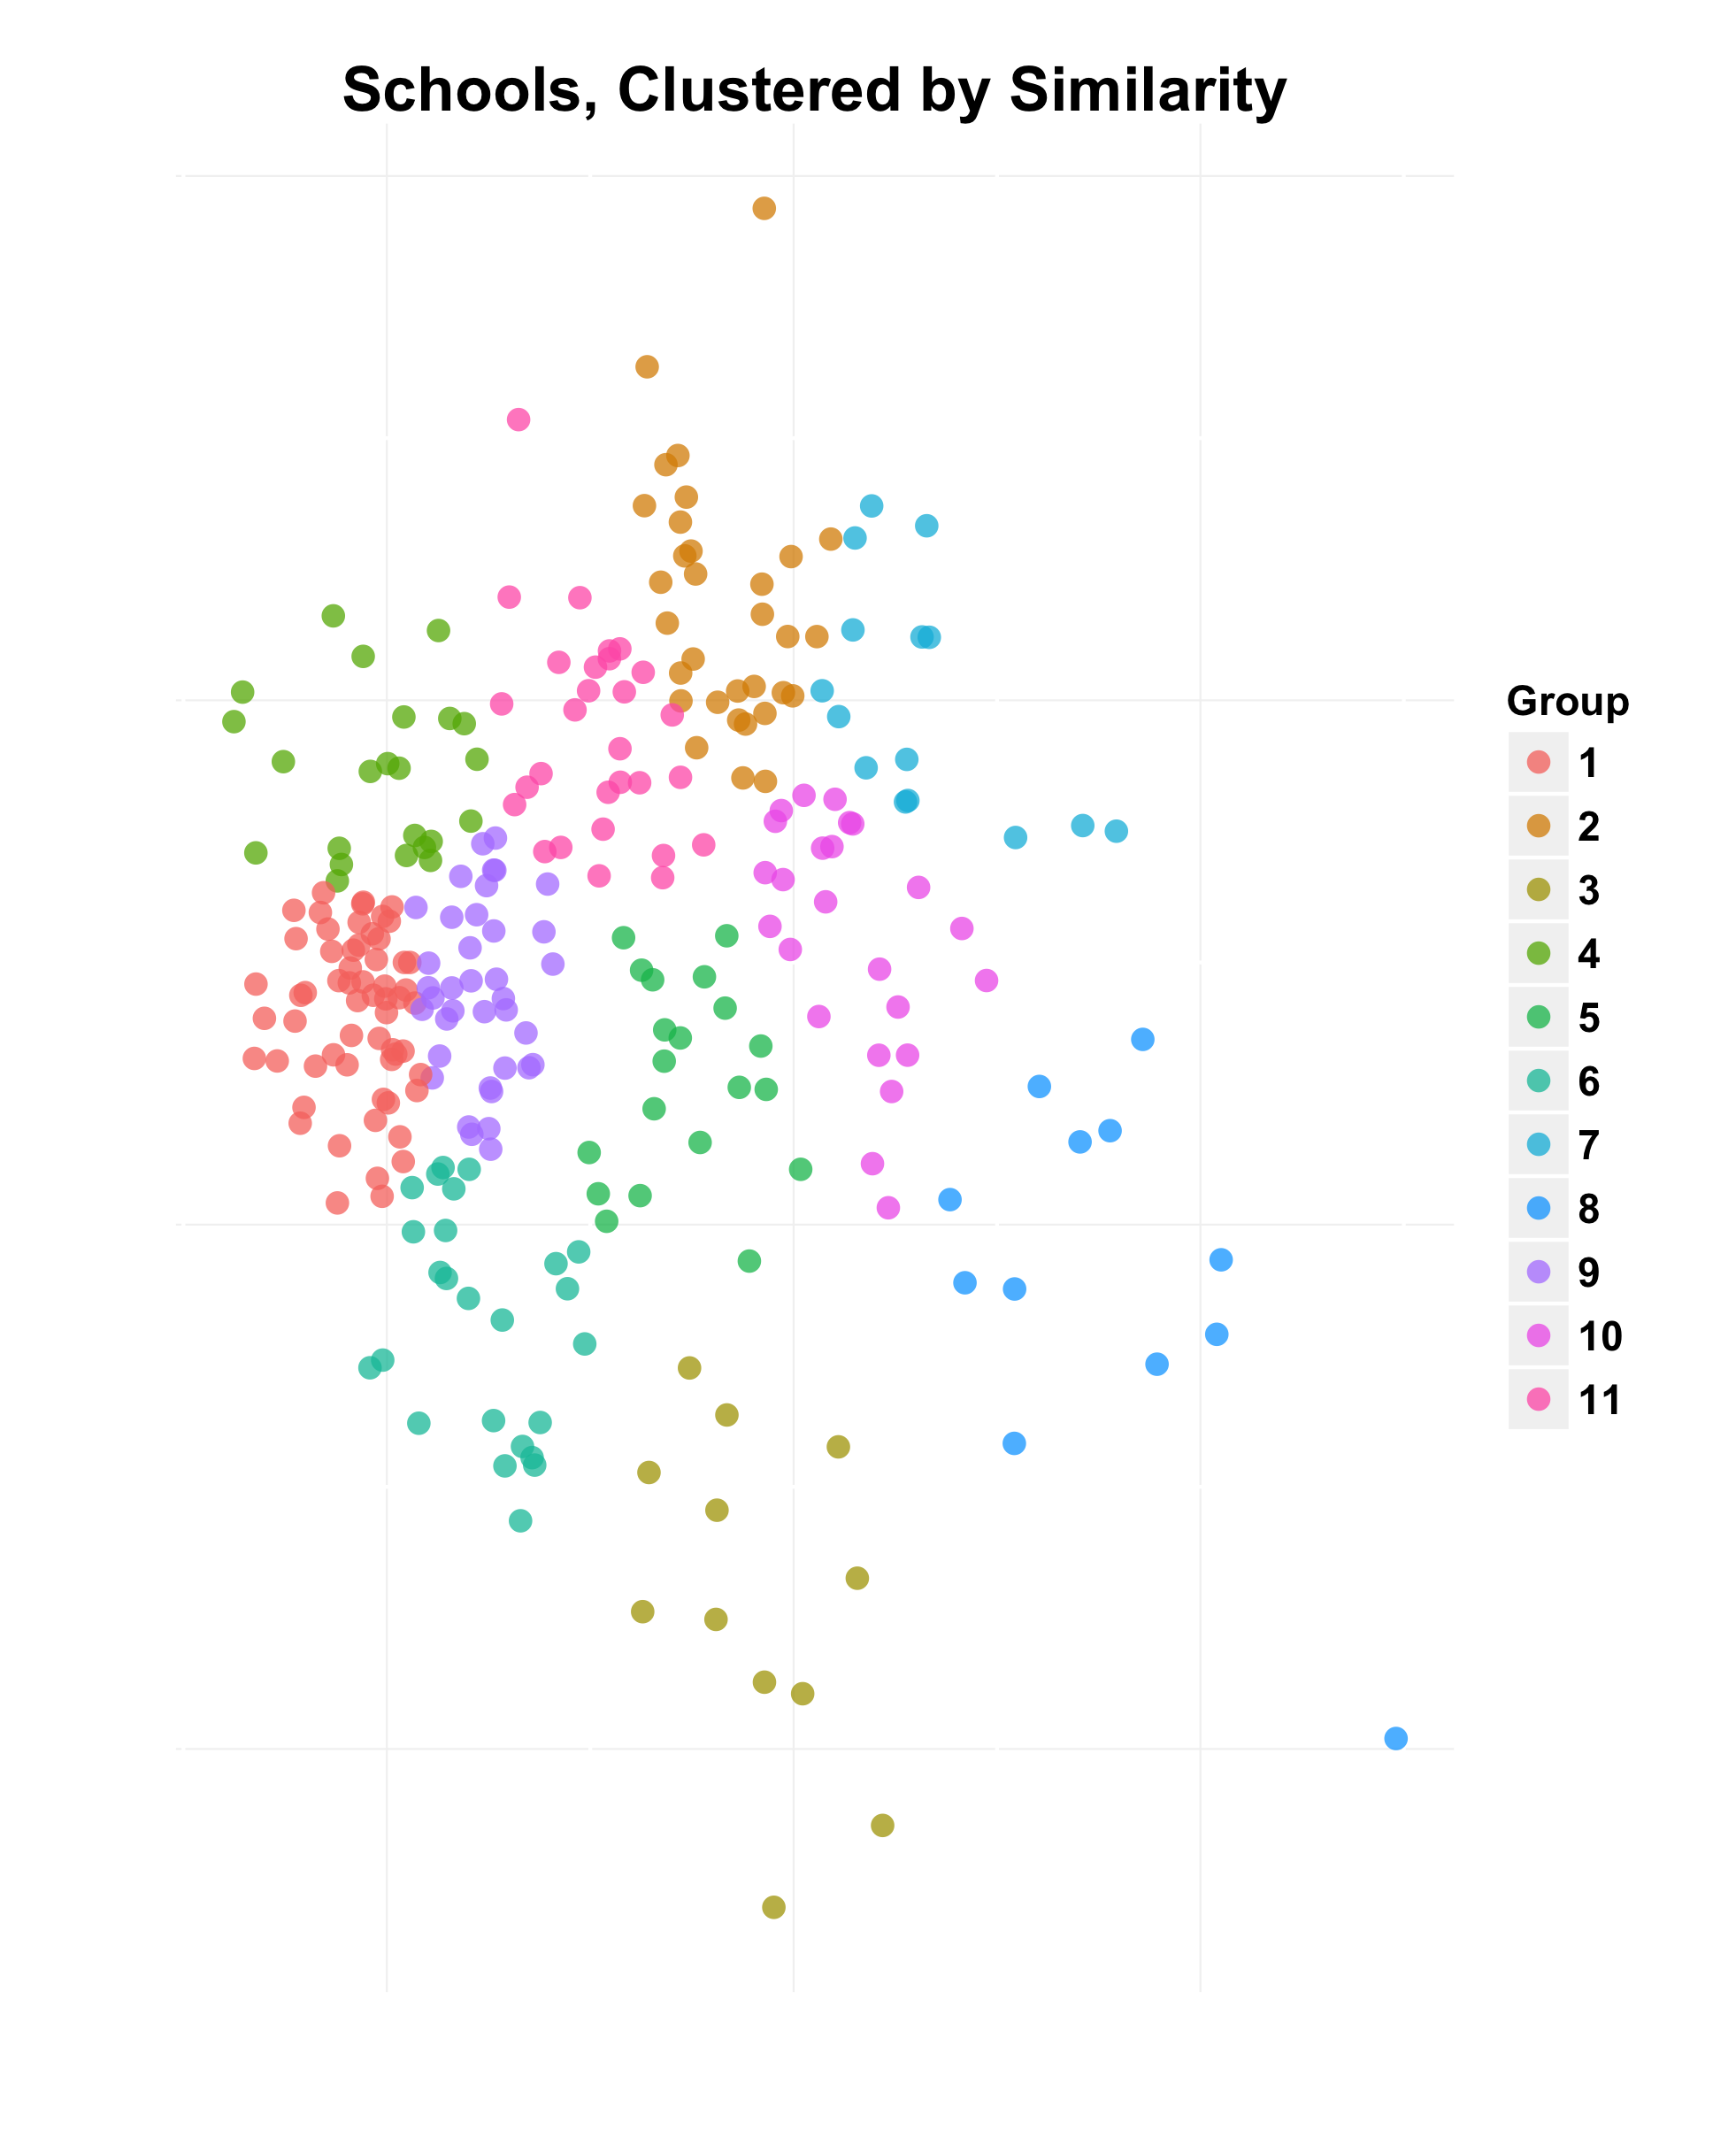
Let’s group schools together using another algorithm, k-means. It belongs to a set of machine learning techniques for clustering.
The k-means algorithm has a limitation: it groups together objects by first computing the Euclidean distance between each. Euclidean distance treats each variable as equally important, which is not true for this example. We will compensate for this by ‘weighting’ each variable according to its importance, which the random forest algorithm has already calculated.

We can then assign a group to each school, clustering together similar schools into the same group.
Let’s look at the High Achiever % of each group.
As we can see, each group has some spread of values. This is encouraging, because these schools could learn from each other. High schools of similar size, with similar parental situations and similar demographics are likely to have relevant advice for each other.
Share and Share Alike
This leads me to a triumvirate of conclusions:
Schools/Educators: You aren’t alone. There are many other schools just like yours, doing better and worse. Ask for help in finding them. Then learn from them, and teach in turn. Identify best and worst practices specific to your situation. Spread that information around. The more schools that participate, the more everyone benefits.
Parents: Teachers and principals have limits to their ability to educate children, and it depends on many things. You have a much more profound impact on your children’s education than their teachers do. You can’t dodge that responsibility, so don’t try. And for goodness sake, be careful about what data you pay attention to. Good test and SAT scores don’t predict whether your child will be happy or successful in 10 years.
Analysts/Data Scientists: Like all professionals, we have a choice of what to do with our talent. Each of us has access to huge amounts of data. We can use our skill and energy to make the world a better place. I encourage everyone to try.
Published 11 February 2013