T-SQL Tuesday #16: Statistics using CLR Aggregates
08 March 2011
[
It is T-SQL Tuesday again, brought to you by Jes Schultz Borland (@Grrl_Geek). The theme for this T-SQL Tuesday is Aggregations.
For my T-SQL Tuesday post, I’ve written up some CLR aggregation functions that can do statistical analysis. I’ve built three of the most common: median(), percentile(), and covariance().
Here’s my code in a ZIP file: MathCLR - By Dev Nambi.
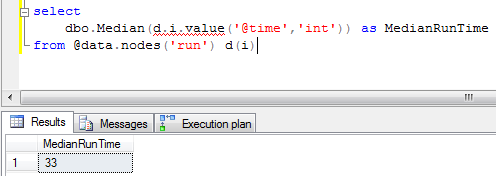
Median
Median finds the middle number in a set of data. If you sorted the numbers and then picked the exact middle value, that is the median.
I’m using the same sample data set from my last post, which is about the runtime of a backup job over the past week. As we can see here, the median runtime is 33 minutes.
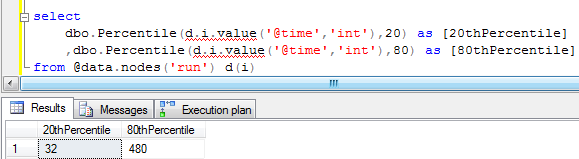
Percentile
Percentile finds the number under which X percent of the values fall. Using our sample data set, we can find that 80% of the backup runtimes are under 480 minutes.
The way to use the function is to pass in the data set as the first parameter, and the percentile you’re looking for as the second.
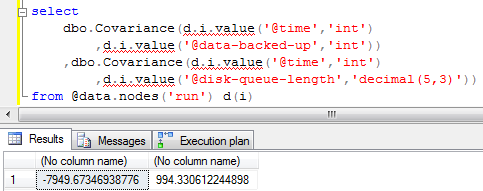
Covariance
Covariance is less well known. It shows the relationship between two sets of numbers. It finds the _correlations _between two sets of numbers.
Using our data set, let’s see if there’s a relationship between backup time and the amount of data backed up. As we can see below, the covariance is negative. That means that either the backups get faster as they get larger (unlikely), or something else is at work.
How about a relationship between disk queue length on the backup file server and the runtime? Aha! That shows a very high covariance, suggesting that the disks on the backup file server are the bottleneck. Either the backup server is too slow, or else some other process is slowing it down.
Good luck with your analysis!